By GraphDex Research · Reviewed for accuracy May 2026
Quick Answer
Chart patterns are recurring price formations that signal probable future moves. The most reliable patterns fall into three categories:
- Reversal patterns: Head and shoulders, double tops/bottoms, triple tops/bottoms, rounding bottoms
- Continuation patterns: Flags, pennants, triangles (ascending/descending/symmetrical), rectangles
- Bilateral patterns: Triangles can break either direction; cup and handle is generally bullish
Key facts: Patterns work best at significant support/resistance levels with volume confirmation. They provide probabilistic edges (55-70% win rates for skilled traders) — not certainties. Most failed pattern trades come from forcing patterns where none exist or ignoring volume.
The honest truth: A well-defined pattern at a major level with volume confirmation is a real edge. A vague pattern in the middle of a range with thin volume is noise.
Trade chart patterns on Solana via GraphDex
Key Takeaways
- Chart patterns provide probabilistic edges — 55-70% win rates for properly identified setups.
- Reversal patterns work best at extended trend extremes; continuation patterns work best within trends.
- Volume confirmation is essential — pattern + low volume = weak signal.
- Wait for confirmation breakouts; don't anticipate patterns that haven't completed.
Why Chart Patterns Work
Chart patterns are repeating price formations that have appeared across markets, asset classes, and decades. They work because they reflect collective human psychology — and human psychology is more constant than any technology, narrative, or market structure.
The psychology behind patterns:
- Fear and greed drive every market participant
- Memory of past price levels creates support and resistance
- FOMO and capitulation create predictable extremes
- Profit-taking and stop-running create predictable reactions
These emotional drivers create recurring formations. A head-and-shoulders pattern in 2026 crypto looks remarkably similar to one in 1990 stocks because the underlying psychology is identical.
Why patterns work better in crypto specifically:
- Retail-dominated markets (vs institutional algorithmic trading)
- 24/7 markets allow uninterrupted pattern formation
- Less fundamental analysis competing with price action
- Social momentum amplifies emotional reactions
What patterns don't do:
- Guarantee outcomes (even great patterns fail 30-45% of the time)
- Work without context (a "perfect" pattern in random noise is meaningless)
- Replace risk management (the best patterns can still lose)
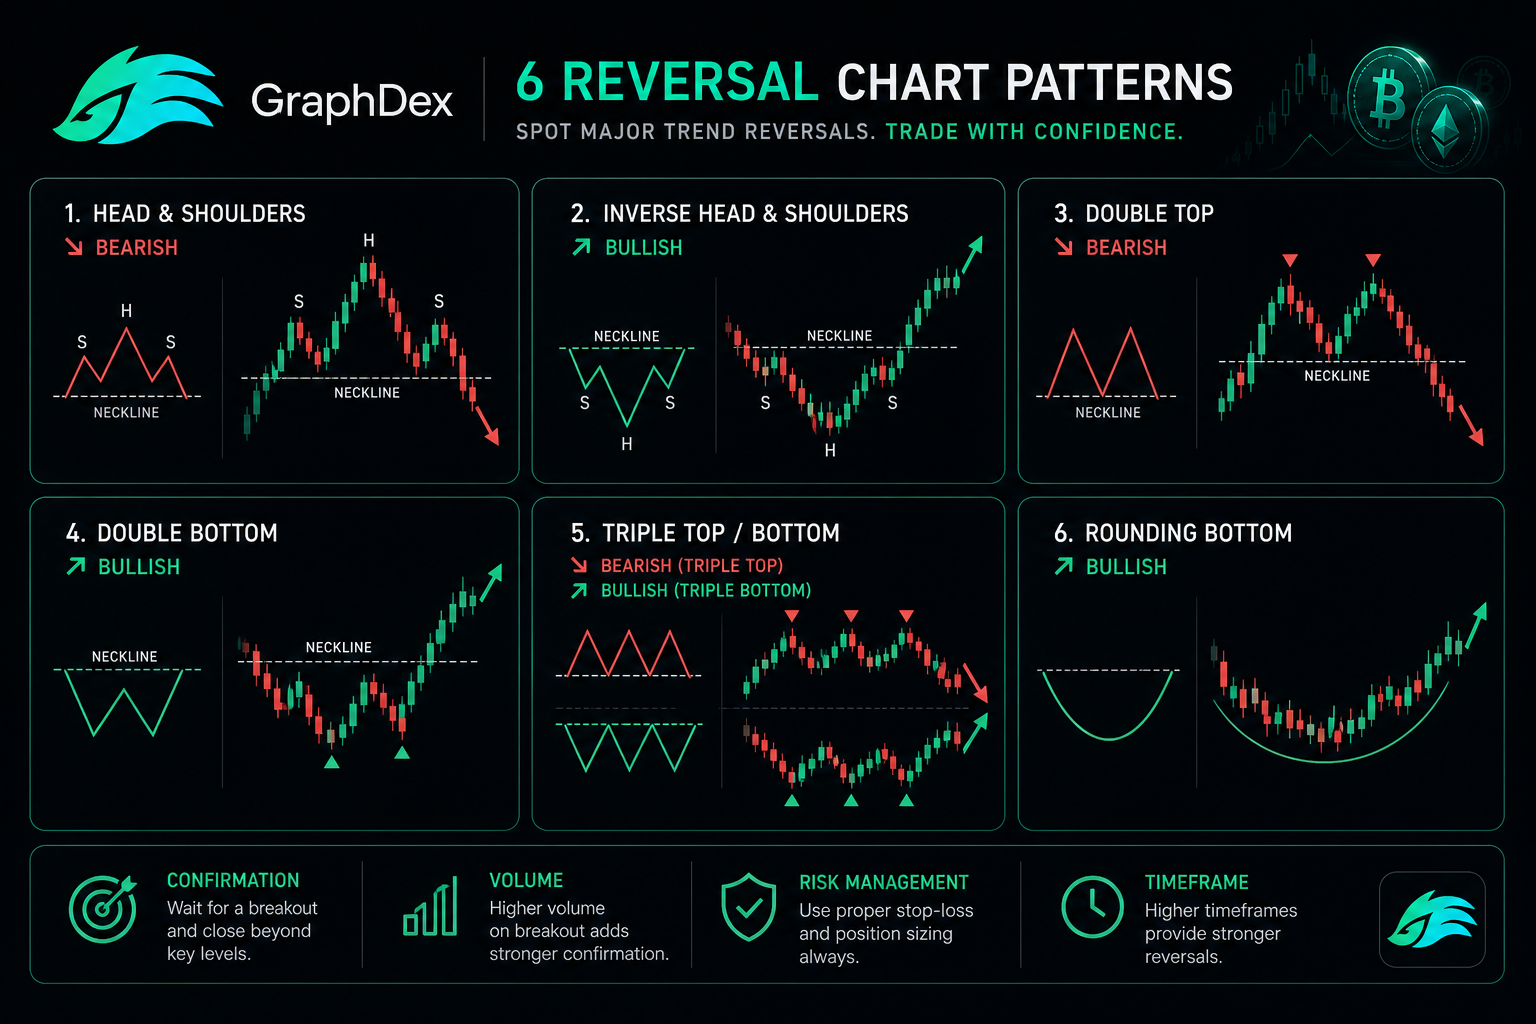
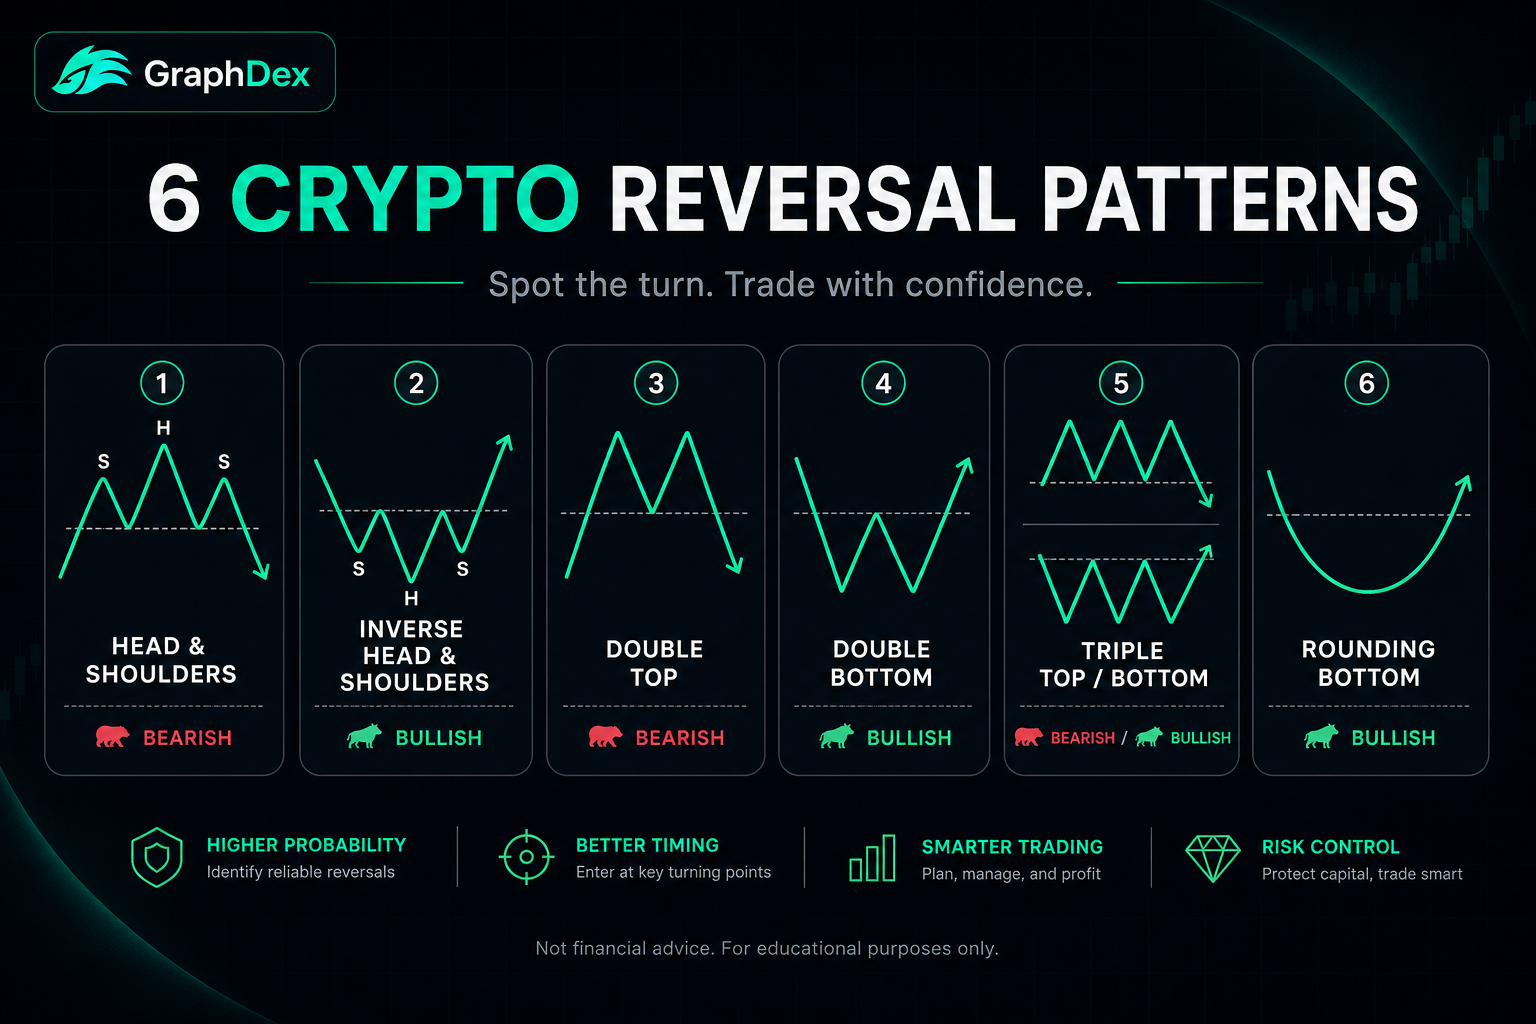
Reversal Patterns: Signaling Trend Changes
Reversal patterns appear at trend extremes and signal probable trend changes. The most reliable ones:
Head and Shoulders
The pattern: Three peaks — a higher middle peak (the "head") flanked by two lower peaks (the "shoulders"). The "neckline" connects the lows between peaks.
What it signals: Bearish reversal after an uptrend. Buyers attempted three pushes, with the middle one strongest, but the third attempt failed at a lower level — trend exhaustion.
Trading the pattern:
- Wait for the neckline break with volume confirmation
- Entry: After neckline break or on retest
- Stop loss: Above the right shoulder
- Target: Distance from head to neckline projected downward
Win rate: Properly identified and traded head-and-shoulders patterns achieve 60-65% win rates with 2:1+ risk-reward profiles.
Inverse Head and Shoulders
The pattern: Mirror image of standard H&S — three troughs with the middle (head) lowest, flanked by two higher lows (shoulders).
What it signals: Bullish reversal after a downtrend.
Trading: Same principles as H&S but inverted. Wait for neckline break, retest, target measured move.
Double Top
The pattern: Two consecutive peaks at approximately the same level, separated by a trough.
What it signals: Bearish reversal. Two failed attempts to break resistance suggest sellers have control.
Trading the pattern:
- Wait for the trough between peaks to break (the "confirmation")
- Entry: On break of intervening low
- Stop loss: Above the higher of the two tops
- Target: Distance from top to intervening low, projected downward
Double Bottom
The pattern: Two consecutive troughs at approximately the same level, separated by a peak. Mirror image of double top.
What it signals: Bullish reversal. Two failed attempts to break below support suggest buyers have control.
Trading: Inverse of double top — wait for intervening peak break, enter, target measured move.
Triple Top and Triple Bottom
The pattern: Three consecutive peaks (top) or troughs (bottom) at approximately the same level. Same idea as double, but with an additional test.
What it signals: Stronger version of double pattern. Three failed attempts to break a level signal strong rejection.
Trading: Same principles as double, but with higher conviction due to additional confirmation.
Rounding Bottom (Saucer)
The pattern: A gradual U-shaped bottom forming over weeks or months. Slow shift from downtrend to uptrend.
What it signals: Long-term bullish reversal. Often appears at major accumulation zones.
Trading:
- Difficult to time exact entries due to gradual nature
- Entry: After clear break above the rim of the saucer with volume
- Stop loss: Below the lowest point of the saucer
- Target: Often substantial — rounding bottoms can precede major bull runs
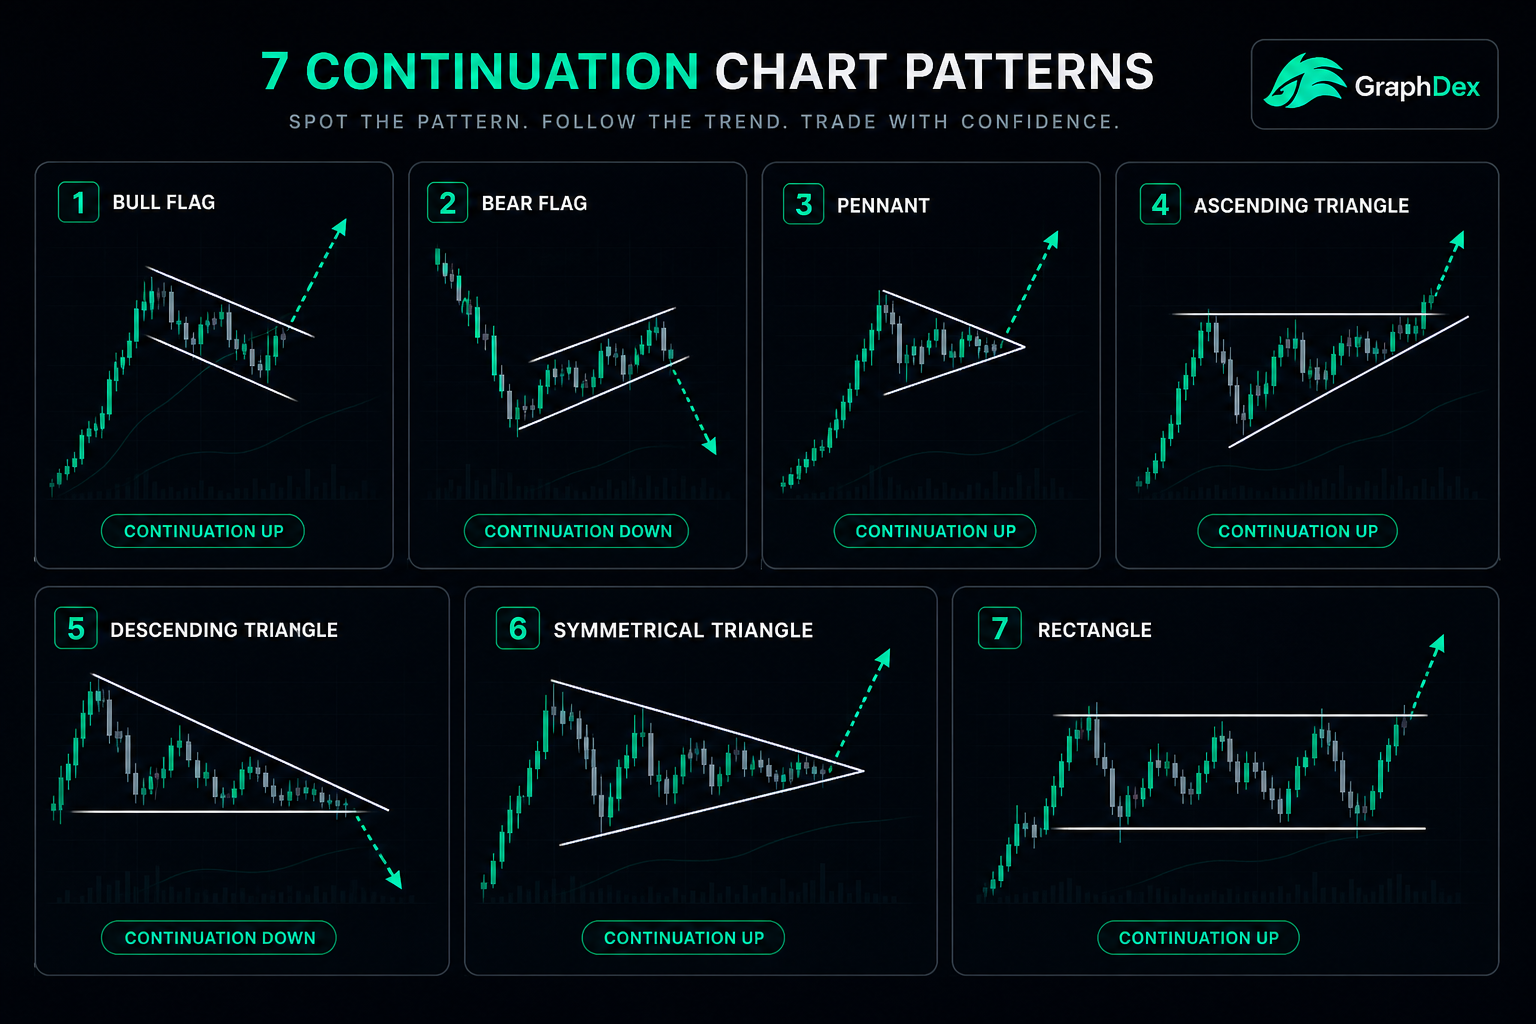
Continuation Patterns: Trend Persistence Signals
Continuation patterns appear during trends and signal probable trend continuation after a pause.
Bull Flag
The pattern: A sharp upward move ("flagpole") followed by a small downward-sloping consolidation channel (the "flag").
What it signals: Brief consolidation before the trend resumes upward.
Trading the pattern:
- Wait for break above the upper trendline of the flag
- Entry: On flag breakout with volume
- Stop loss: Below the flag's lower trendline
- Target: Distance of original flagpole projected upward from breakout point
Bear Flag
The pattern: Sharp downward move followed by upward-sloping consolidation.
What it signals: Brief consolidation before downtrend resumption.
Trading: Mirror image of bull flag — wait for downside break, target measured move.
Pennant
The pattern: Similar to flag but with converging trendlines (forming a small symmetrical triangle) instead of parallel ones.
What it signals: Same as flag — continuation of prior trend after brief consolidation.
Trading: Same approach as flag. Direction of breakout typically matches prior trend.
Ascending Triangle
The pattern: Flat upper resistance line and rising lower trendline. Buyers progressively willing to pay more while sellers hold a level.
What it signals: Generally bullish. The pattern suggests buyers will eventually overwhelm the static resistance.
Trading the pattern:
- Entry: On break above flat resistance with volume
- Stop loss: Below the rising trendline
- Target: Triangle height projected upward from breakout
Caveat: Can fail and break downward — wait for confirmation rather than assuming the bullish direction.
Descending Triangle
The pattern: Flat lower support line and falling upper trendline. Mirror image of ascending triangle.
What it signals: Generally bearish. Sellers progressively willing to accept less while buyers defend a level.
Trading: Wait for break below flat support, target measured move down.
Symmetrical Triangle
The pattern: Converging trendlines from both directions — lower highs and higher lows.
What it signals: Direction unclear until breakout. Often continuation, but can be reversal.
Trading:
- Don't anticipate direction — wait for breakout with volume
- Entry: On confirmed break with volume confirmation
- Stop loss: Just inside the opposite side of the triangle
- Target: Triangle height projected from breakout
Rectangle (Range)
The pattern: Price oscillating between clear horizontal support and resistance.
What it signals: Consolidation. Eventual breakout direction often determines next major move.
Trading:
- Range trade until breakout: buy support, sell resistance
- On breakout: enter direction of break with volume confirmation
- Stop loss: Back inside the range
- Target: Range height projected from breakout
Bilateral and Special Patterns
Cup and Handle
The pattern: A "cup" — gradual rounded bottom — followed by a smaller pullback ("handle") and then breakout.
What it signals: Bullish continuation or reversal. The handle represents final shake-out of weak hands before the resumption of the uptrend.
Trading:
- Entry: On breakout above the cup's resistance level
- Stop loss: Below the handle
- Target: Cup depth projected upward from breakout
Famous in: Originally identified by William O'Neil for stocks. Highly reliable in crypto for major moves.
Wedge Patterns
Rising wedge: Both lines slope up, with the lower line steeper. Despite upward slope, this is typically bearish — buyers are losing momentum.
Falling wedge: Both lines slope down, with the upper line steeper. Despite downward slope, this is typically bullish — sellers are losing momentum.
Trading: Wait for break against the wedge's slope direction. Surprising reversal patterns.
How to Identify Patterns Correctly
The biggest mistake beginners make: seeing patterns that aren't really there.
Pattern Validity Checklist
1. Clear formation: The pattern should be obvious. If you have to squint or rationalize, it probably isn't a valid pattern.
2. Sufficient time: Reliable patterns form over reasonable timeframes. A "head and shoulders" formed over 3 candles is not the same as one formed over 30.
3. Context: Patterns at significant support/resistance levels are more reliable. Patterns in the middle of ranges are less reliable.
4. Volume confirmation: Volume should generally decrease during pattern formation and expand on breakout. No volume on breakout = high failure risk.
5. Multi-timeframe alignment: A pattern on the 4-hour chart aligned with the daily trend is stronger than one fighting the higher timeframe.
6. Avoidance of "pareidolia": Humans see patterns in random noise. Be skeptical of fuzzy, ambiguous formations.
When Patterns Fail
Even well-identified patterns fail 30-45% of the time. Common failure modes:
1. False breakouts: Price breaks the pattern level briefly but quickly reverses. Wait for clear, sustained breakouts with volume.
2. Pattern within larger structure: A bullish pattern within a larger bearish structure may fail because the bigger trend wins.
3. News/catalyst override: Unexpected news (regulatory announcements, exchange hacks, macro events) can override any technical pattern.
4. Manipulation in low-liquidity: Memecoins and small-caps can have "perfect" patterns manufactured by single large traders.
5. Pattern fatigue: Patterns work less reliably when too obvious — algorithmic traders front-run them.
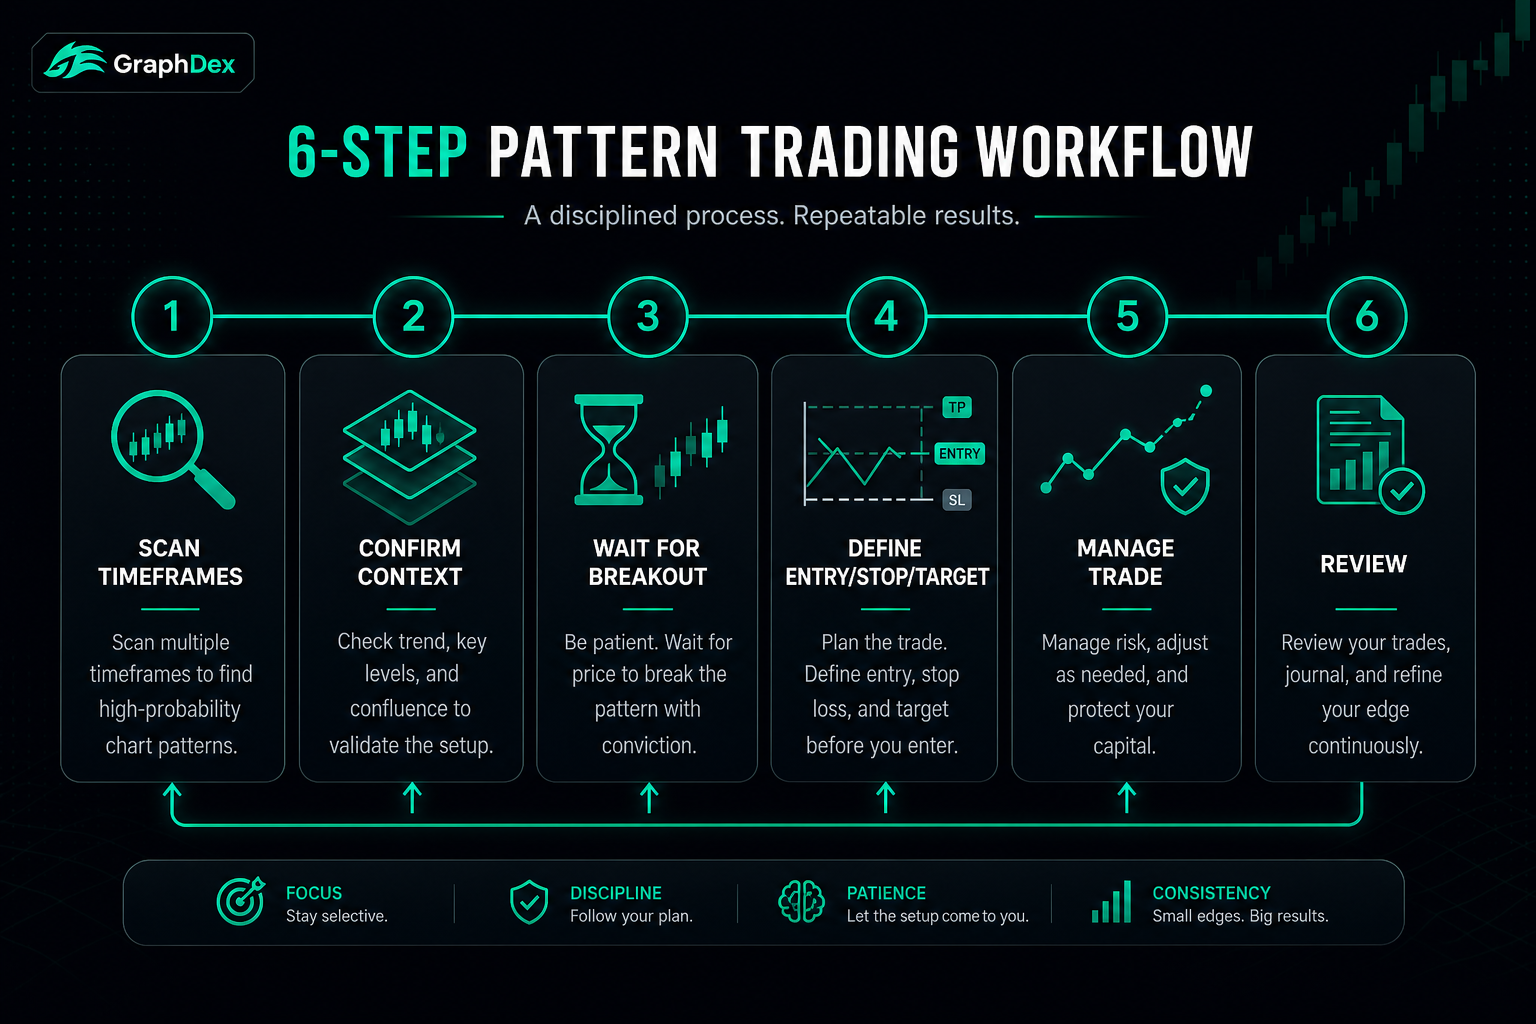
Trading Patterns: The Practical Workflow
For consistent pattern trading:
Step 1: Scan for Patterns Across Timeframes
Use higher timeframes (daily, 4-hour) for primary patterns. Confirm on lower timeframes for entry precision.
Step 2: Confirm Context
- Is the pattern at significant support/resistance?
- Does it align with the higher timeframe trend?
- Is there confluence with other technical factors (Fibonacci, moving averages)?
Step 3: Wait for Confirmation
The single most important rule: don't anticipate patterns. Wait for completion and breakout with volume.
Step 4: Define Your Entry, Stop, and Target
Before entering, know:
- Exact entry price (breakout level + buffer for noise)
- Stop loss (where the pattern is invalidated)
- Target (measured move from pattern)
- Risk-reward ratio (should be at least 2:1)
Step 5: Manage the Trade
- Move stop to breakeven once price moves favorably
- Take partial profits at key resistance/support levels
- Let winners run; cut losers quickly
- Don't move stops against you to "give the trade more room"
Step 6: Review Every Trade
- Was the pattern valid?
- Did you wait for confirmation?
- Was your risk management proper?
- What can you improve?
Common Pattern Trading Mistakes
For balance, the patterns of failure for traders using chart patterns:
1. Pattern fitting. Seeing patterns that aren't really there because you want to trade.
2. Entering before confirmation. Anticipating breakouts that haven't happened. Many "almost" patterns fail.
3. Ignoring volume. Pattern + low volume breakout = high failure rate.
4. Trading every pattern. Selectivity wins. Focus on high-confluence setups with clear context.
5. Wrong timeframe. Trying to swing trade off 5-minute patterns. Match pattern timeframe to your trading style.
6. No stop loss. Even great patterns fail. Always have a defined invalidation point.
7. Target greed. Patterns suggest measured moves; greed extends targets and gives back profits. Take partial profits.
8. Fighting higher timeframes. A bullish pattern on 4-hour against a daily downtrend usually fails.
9. News-time trading. Patterns get invalidated by news catalysts. Avoid major economic releases and known event windows.
Practice pattern trading on Solana via GraphDex
Chart Patterns in Different Market Conditions
Important: patterns work differently in different conditions.
Trending Markets
- Continuation patterns (flags, pennants, ascending triangles) work best
- Trade with the trend on pullbacks/consolidations
- Reversal patterns less reliable until extended trends show exhaustion
Ranging Markets
- Rectangle patterns define clear levels
- Buy support, sell resistance until breakout
- Reversal patterns at range extremes work well
- Continuation patterns less reliable
High Volatility (News-Driven)
- All patterns less reliable due to overriding fundamentals
- Wait for clarity before trading patterns
- Use wider stop losses to account for volatility
Low Volatility (Consolidation)
- Patterns develop more cleanly
- Breakouts after long consolidation often produce major moves
- Wedge and triangle squeezes precede expansion
How GraphDex Supports Pattern Trading
For active Solana traders applying chart patterns:
- Multi-timeframe charts for pattern identification across timeframes
- Volume integration confirming pattern breakouts
- Bubble Maps combining patterns with on-chain holder analysis
- Pulse feed surfacing new tokens forming early patterns
- AI signals identifying high-confluence pattern setups
- MEV protection preventing sandwich attacks on pattern breakouts
- Fee-based 17% APY staking on stablecoins between trades
- Non-custodial Privy wallet — sign in with Twitter, email, or Telegram
Active Solana traders get professional charting integrated with execution — no juggling between TradingView, Phantom, and a separate trading platform.
Trade Solana with integrated chart analysis on GraphDex
Frequently Asked Questions
Do chart patterns actually work in crypto? Yes, often better than in traditional markets. Crypto's retail-dominated, 24/7 nature creates clear patterns driven by collective psychology. Properly identified patterns at significant levels with volume confirmation achieve 55-70% win rates for skilled traders. The key word is "properly identified" — most pattern failures come from forcing patterns that aren't really there.
What is the most reliable chart pattern? The head and shoulders pattern is widely considered among the most reliable reversal patterns. For continuation, bull/bear flags work consistently in trending markets. Double tops and double bottoms are reliable at major support/resistance. The "most reliable" pattern depends on market conditions — match patterns to conditions.
How long does it take to learn chart patterns? Basic recognition: 1-3 months. Intermediate skill with proper context evaluation: 6-12 months. True mastery where patterns drive consistent profits: 1-2 years of focused practice. Most traders give up before reaching the mastery level — patience and journaling separate those who succeed.
Should I trade before a pattern completes? No. The single biggest mistake in pattern trading is anticipating patterns that haven't completed. Wait for clear breakouts with volume confirmation. Many "almost" patterns fail completely, while completed patterns with confirmation have much higher success rates.
What's the difference between flag and pennant patterns? A flag has parallel trendlines forming a small channel; a pennant has converging trendlines forming a small triangle. Both signal continuation after a sharp prior move (the "flagpole"). They function identically — wait for breakout in direction of prior trend with volume.
Can chart patterns be used for memecoins? Yes, but with major caveats. Memecoin patterns are less reliable due to: low liquidity (single large traders override patterns), shorter timeframes (patterns develop quickly), manipulation potential, and short token lifespans. Combine traditional patterns with on-chain analysis (Bubble Maps holder distribution, bonding curve graduation points).
How many patterns should I memorize? 12-15 patterns covered in this guide handle 90%+ of real trading opportunities. Don't try to memorize 50+ obscure patterns from various trading books. Master the major patterns deeply rather than knowing many shallowly. Quality over quantity in pattern recognition.
About This Guide
This guide is published by the GraphDex Research team — analysts and traders building the infrastructure for digital asset trading on Solana. Our content is based on direct trading experience, current market data, and widely-accepted chart pattern principles.
Sources & data: Pattern descriptions reflect standard technical analysis as practiced in 2026. Chart patterns provide probabilistic edges, not guarantees — all trading carries risk of loss. This guide is educational and not financial advice.
GraphDex is the infrastructure for digital asset trading — trade, predict, and earn in one place. Learn more at graphdex.io.
Last reviewed: May 2026 · GraphDex Research
The infrastructure for digital asset trading. Trade, predict, stake, repeat. graphdex.io


