Quick Answer
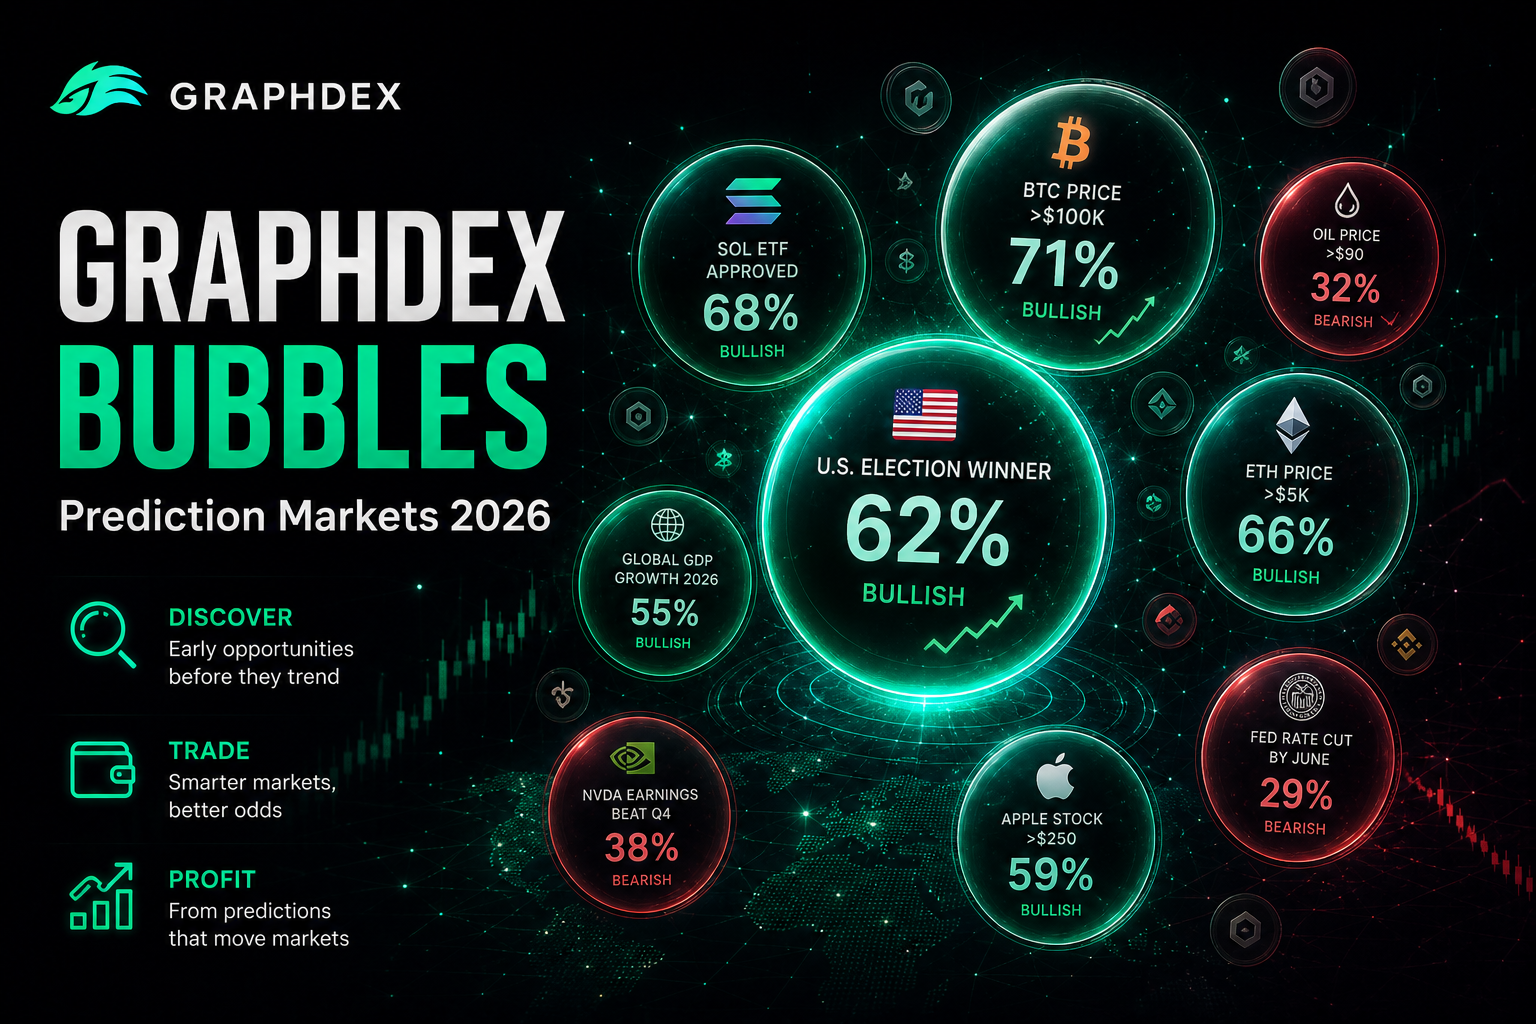
Bubbles is GraphDex's visual prediction market screener. It displays the top prediction markets as bubbles where:
- Bubble size = trading volume (or liquidity — switchable)
- Green outline = probability rising over the period
- Red outline = probability falling over the period
- Percentage = the change in probability
- Click any bubble = jump straight to trading that market
It turns hundreds of markets into one screen you can read in seconds.
Explore prediction markets visually on GraphDex
Key Takeaways
- Bubbles maps prediction markets by volume/liquidity with color-coded probability momentum.
- Visual screening beats scrolling long lists when thousands of markets are active.
- Click-through from a bubble to execution reduces the delay that kills momentum trades.
- Bubbles sits inside GraphDex alongside copytrading and Polymarket integration.
The Problem Bubbles Solves
Prediction markets exploded in 2026. There are thousands of active markets across politics, sports, crypto, and world events. On a traditional list-based interface, finding the markets worth trading means scrolling endlessly, opening each one, checking volume and price movement, and going back.
This is slow. By the time you have manually reviewed fifty markets, the momentum you were looking for may have already moved.
The human brain processes visual information far faster than lists of numbers. A screen of sized, colored bubbles communicates volume and momentum across a hundred markets instantly — something a text list can never do.
GraphDex Bubbles applies this principle to prediction markets. One glance tells you which markets have the most volume, which probabilities are moving, and in which direction.
How to Read GraphDex Bubbles
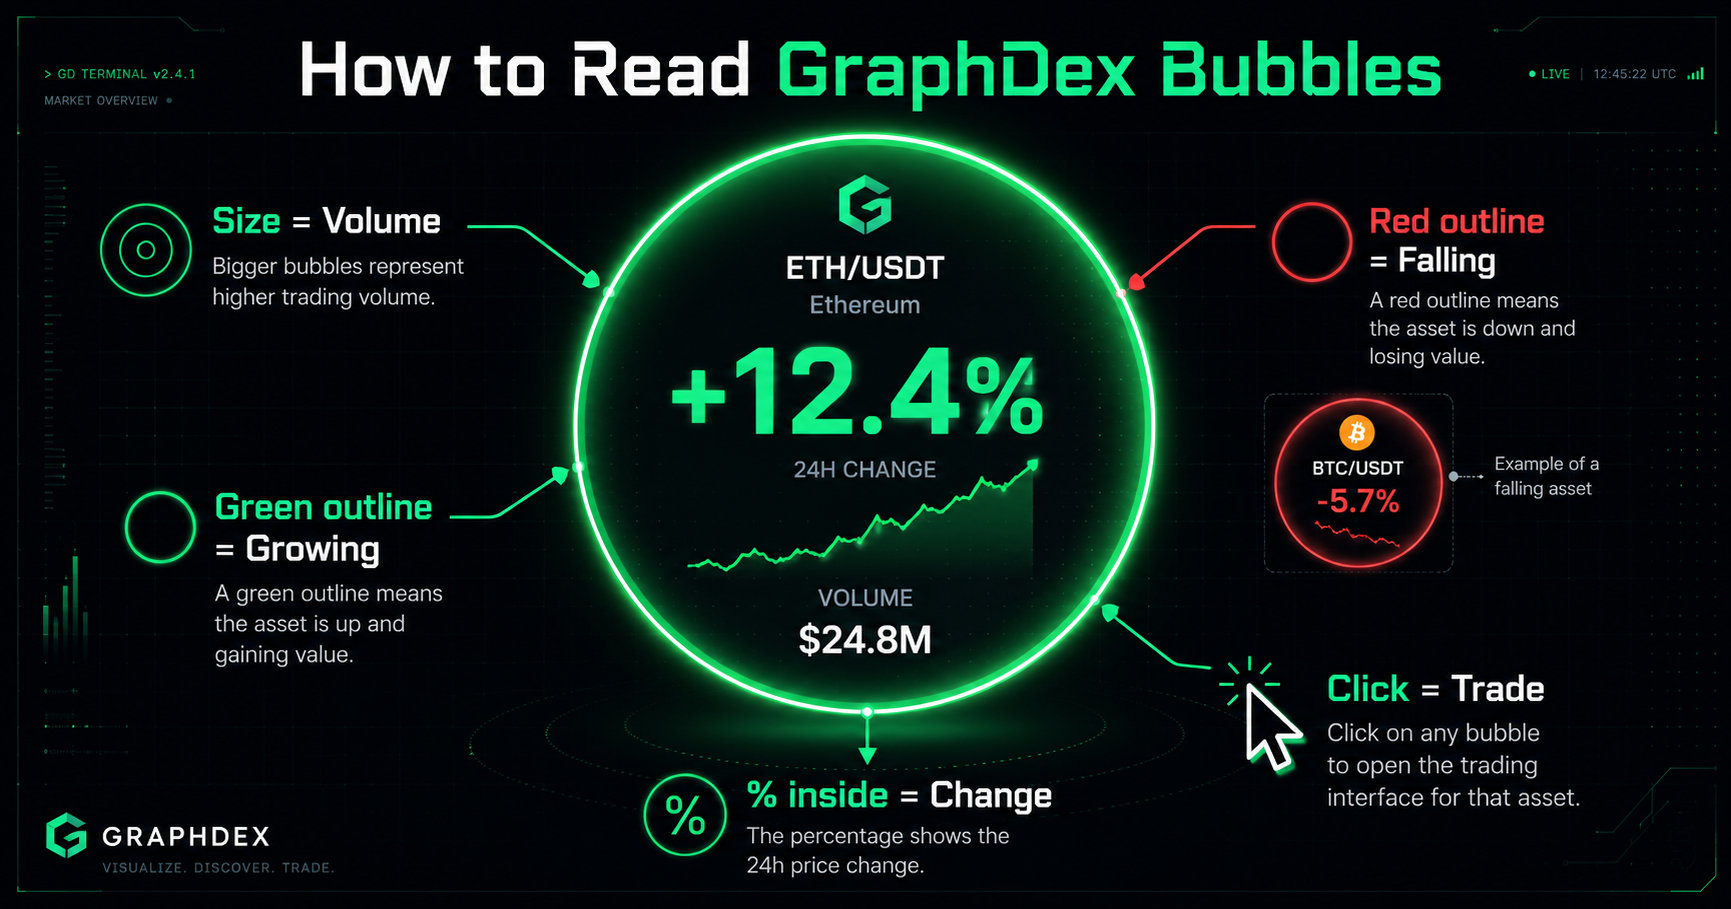
Bubble Size = Volume
The larger the bubble, the more trading volume that market has. Large bubbles are the markets where the action is — high participation, deep liquidity, tight spreads. Small bubbles are quieter markets with less activity.
You can switch the size metric between Volume and Liquidity depending on what you are looking for. Volume shows where trading is happening; liquidity shows where you can enter and exit large positions without slippage.
Color = Momentum Direction
Green outline: the market's probability is rising over the selected period. Sentiment is shifting toward "Yes."
Red outline: the market's probability is falling. Sentiment is shifting toward "No."
The color gives you instant directional read across the entire board. A cluster of green bubbles in one category signals momentum building in that direction.
Percentage = Magnitude of Change
The percentage inside each bubble shows how much the probability has moved over the period — for example +1.05% or -2.50%. Larger moves indicate markets where sentiment is shifting fastest. These are often the most interesting markets to investigate.
Time Period: 1H / 24H / 7D
Switch the period to change the timeframe of the momentum reading:
- 1H — short-term moves, useful for fast-moving news events
- 24H — the default, balances signal and noise
- 7D — longer-term sentiment shifts
A market that is flat on 24H but strongly green on 7D tells a different story than one spiking green on 1H.
See the live Bubbles board on GraphDex
Filtering by Category
GraphDex Bubbles lets you filter the board by category:
- All — every market, the full picture
- Politics + World — elections, geopolitics, policy outcomes
- Crypto — Bitcoin price targets, ecosystem events, token outcomes
- Sports + Esports — match outcomes, tournament winners
- Pop / Tech / Biz — culture, technology, business events
Filtering lets you focus on the domain where you have an edge. A trader who follows crypto closely can isolate the Crypto category and immediately see which Bitcoin and ecosystem markets have volume and momentum.
How to Use Bubbles to Find Opportunities
Strategy 1: Spot Momentum Early
Scan for bubbles with strong color and high percentage change. A market turning sharply green on the 1H view means probability is moving fast — often in response to breaking news. If you can interpret the news faster than the market fully prices it, there is an edge.
Strategy 2: Find High-Volume Markets
Large bubbles are where liquidity lives. For traders who want to enter and exit positions cleanly without moving the market, the biggest bubbles are the safest venues. Switch the metric to Liquidity to confirm depth.
Strategy 3: Identify Category-Wide Shifts
When an entire category turns green or red, something systemic is happening. A wave of green across Politics + World markets might signal a shift in sentiment around a major event. Spotting the wave early — before it fully prices in — is the opportunity.
Strategy 4: Compare Periods for Confirmation
A market that is green on 1H, 24H, and 7D shows sustained momentum, not a brief spike. Cross-checking periods filters out noise and confirms genuine sentiment shifts.
A Worked Example: Reading the Board
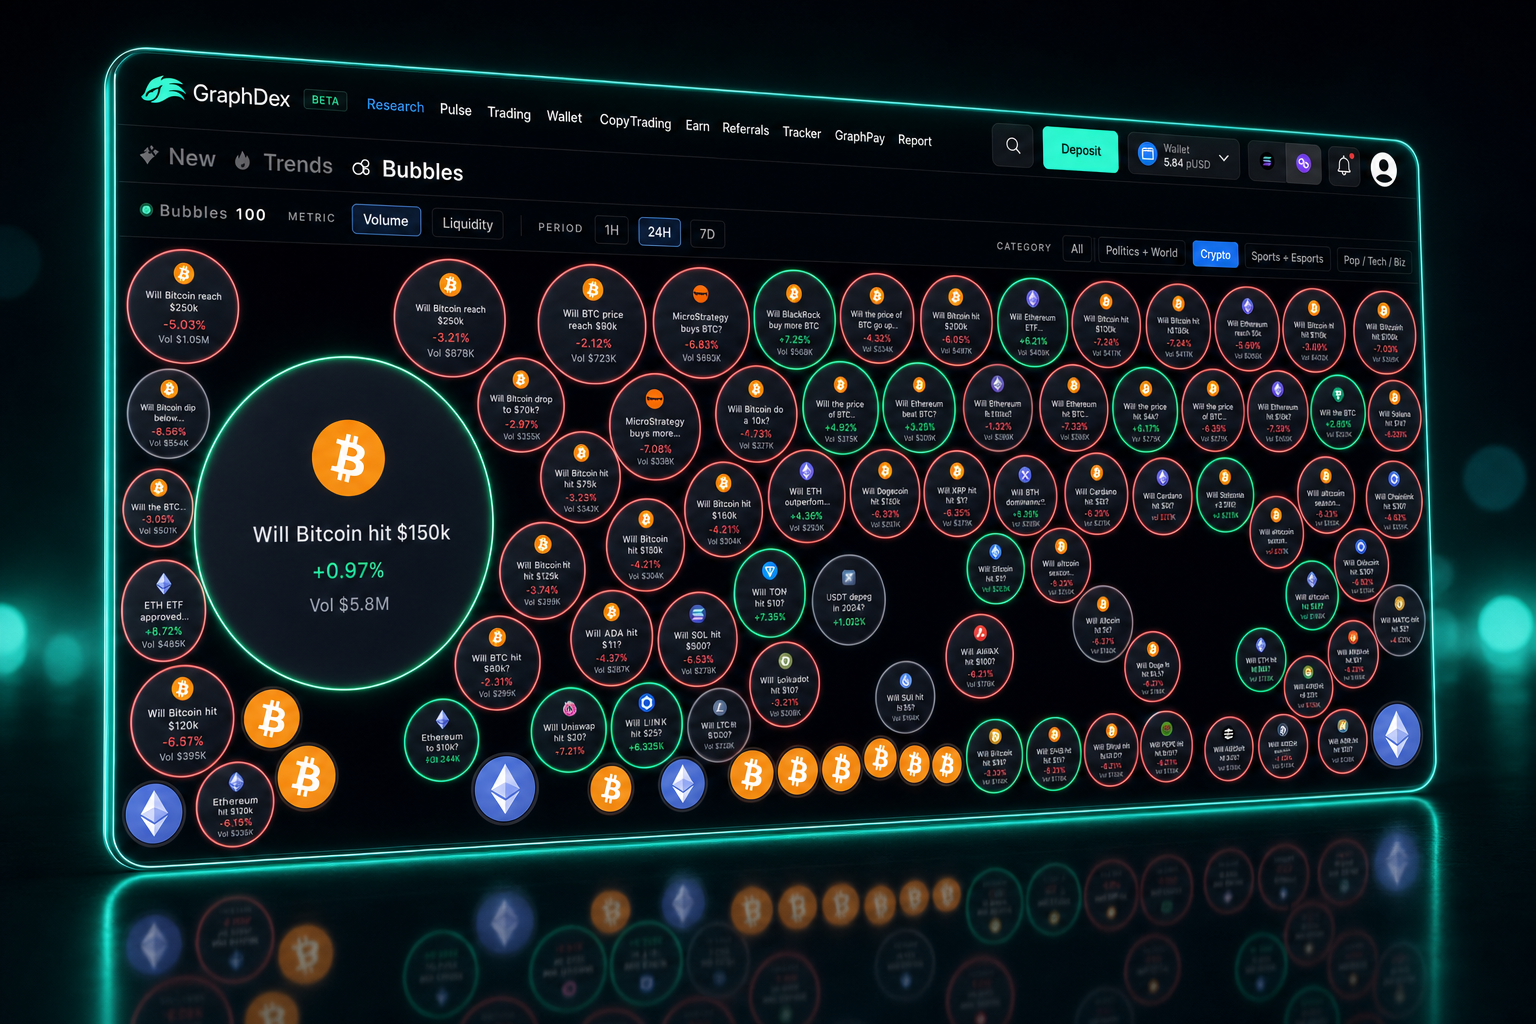
Imagine you open Bubbles on the 24H view with the All category selected. Here is how an experienced trader reads it in seconds:
The biggest bubble on the board is a Bitcoin price market with $5.8M volume — this is where the most money is trading. It is worth knowing what the crowd thinks here even if you do not trade it.
A cluster of green-outlined bubbles appears in the Politics + World category — several geopolitical markets rising together. This suggests a coordinated sentiment shift, possibly driven by breaking news. Worth investigating which event is driving the cluster.
One mid-sized bubble shows a sharp +7.05% move with green outline — the fastest mover on the board. Something just happened in that market. If you can interpret the catalyst faster than the market fully prices it, this is the opportunity to investigate first.
Several small red bubbles scattered across the board are low-volume markets losing probability — generally not worth attention unless you have specific knowledge.
In under ten seconds, you have identified where the volume is, where momentum is building, and which single market is moving fastest. That is the power of visual screening.
When to Use Each Metric and Period
Use Volume sizing when: you want to see where trading activity and attention are concentrated. Best for finding the markets the crowd cares about most.
Use Liquidity sizing when: you plan to take a larger position and need to know where you can enter and exit without slippage. Best for sizing trades.
Use 1H period when: you are trading around breaking news and need to catch fast probability moves as they happen.
Use 24H period when: you want a balanced daily read — the default for most trading sessions.
Use 7D period when: you are looking for sustained sentiment shifts rather than short-term noise, useful for longer-horizon positions.
Combining metrics and periods sharpens your read. A market that is large on Volume, green on all three periods, and showing a high percentage move is a high-conviction signal — it has activity, sustained momentum, and current velocity all at once.
From Bubble to Trade in One Click
The most important feature: Bubbles is not just a visualization — it is an entry point.
Click any bubble and you jump straight to that prediction market, ready to trade. There is no copying market names, no searching, no switching interfaces. See the opportunity, click the bubble, take the position.
This is what makes Bubbles operationally powerful rather than just visually interesting. The screening and the execution are connected. You spot momentum on the board and act on it in the same flow.
And because GraphDex integrates copytrading for prediction markets, you can also see which markets top forecasters are active in — then mirror their positions automatically. Bubbles shows you where the action is; copytrading lets you follow the people who are winning there.
Trade prediction markets on GraphDex
Why Visual Screening Beats List Screening
Traditional prediction market interfaces show markets as a list: name, price, volume, change — row after row. To find opportunities, you scan rows top to bottom, holding numbers in your head.
Visual screening flips this. Instead of reading numbers sequentially, you perceive the entire market state at once. Size, color, and position communicate volume, direction, and magnitude simultaneously. Your eye is drawn to the biggest, most colorful bubbles — which are exactly the markets worth investigating.
For traders monitoring hundreds of markets, this difference compounds. What takes minutes of scrolling on a list takes seconds of glancing on Bubbles. In fast-moving markets, those saved seconds are the edge.
Bubbles in the Broader GraphDex Terminal
Bubbles is one part of GraphDex's prediction market toolkit, which sits inside the broader trading terminal:
- Bubbles — visual market screener (this feature)
- New — newly created prediction markets
- Trends — trending markets by activity
- Copytrading — follow and mirror top forecasters
- Research — deeper analysis on individual markets
And because GraphDex is a full Solana trading terminal, prediction markets sit alongside DEX trading, the Pulse feed, wallet tracking, and AI signals. A narrative forming in crypto markets often has a corresponding prediction market — and GraphDex lets you see and act on both in one interface.
Frequently Asked Questions
What is Bubbles on GraphDex? Bubbles is a visual prediction market screener that displays the top markets as bubbles sized by trading volume and colored by momentum — green for rising probability, red for falling. Clicking a bubble takes you straight to trading that market.
What does the bubble size mean? Bubble size represents trading volume by default, showing which prediction markets have the most activity. You can switch the metric to Liquidity to see where you can enter and exit large positions with minimal slippage.
What do the colors mean on GraphDex Bubbles? A green outline means the market's probability is rising over the selected period. A red outline means it is falling. The percentage inside shows the magnitude of the change.
Can I trade directly from Bubbles? Yes. Click any bubble and you jump straight to that prediction market, ready to trade. The screening and execution are connected in one flow.
How is Bubbles different from a regular market list? A list shows markets as rows of numbers you scan sequentially. Bubbles communicates volume, direction, and magnitude visually across hundreds of markets at once — far faster for spotting opportunities.
What categories can I filter by? All, Politics + World, Crypto, Sports + Esports, and Pop / Tech / Biz. Filtering lets you focus on the domain where you have the most edge.
Can I combine Bubbles with copytrading? Yes. Bubbles shows you where volume and momentum are. GraphDex copytrading lets you follow top forecasters in those markets and mirror their positions automatically.
The infrastructure for digital asset trading. Trade, predict, stake, repeat. graphdex.io


