By GraphDex Research · Reviewed for accuracy May 2026
Quick Answer
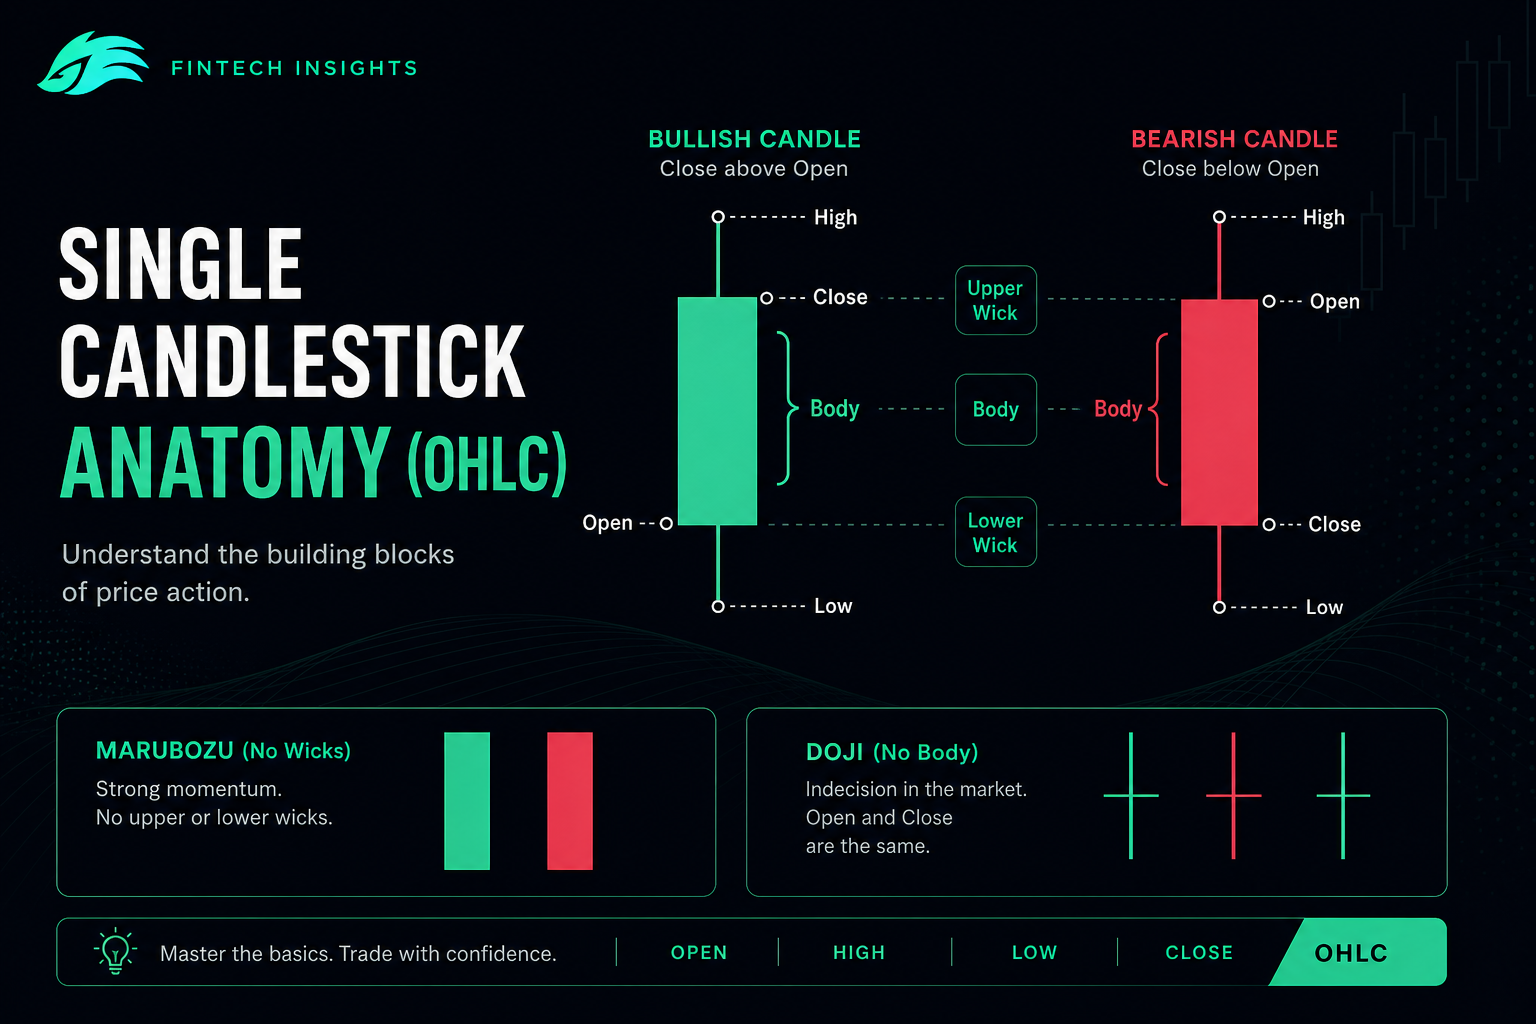
A candlestick is a visual representation of price action over a specific time period — showing open, close, high, and low prices in a single shape. Key facts:
- The body shows the open-to-close range
- The wicks (shadows) show the high-to-low range
- Green/white candles = price closed higher than it opened (bullish period)
- Red/black candles = price closed lower than it opened (bearish period)
- Patterns are formed by single candles or combinations of 2-5 candles
- Most reliable patterns: Engulfing, hammer, shooting star, doji at extremes, morning/evening star
The honest truth: Candlestick patterns are signals, not certainties. A good pattern at a key level with volume confirmation creates a high-probability setup; the same pattern in random market noise means nothing.
Trade Solana with live candlestick charts on GraphDex
Key Takeaways
- A single candlestick shows four prices (OHLC: open, high, low, close) for one time period.
- The body shows direction; wicks show how far price moved during the period.
- Patterns work best at significant support/resistance levels — not in the middle of ranges.
- Master 10-15 reliable patterns rather than memorizing 50+ obscure ones.
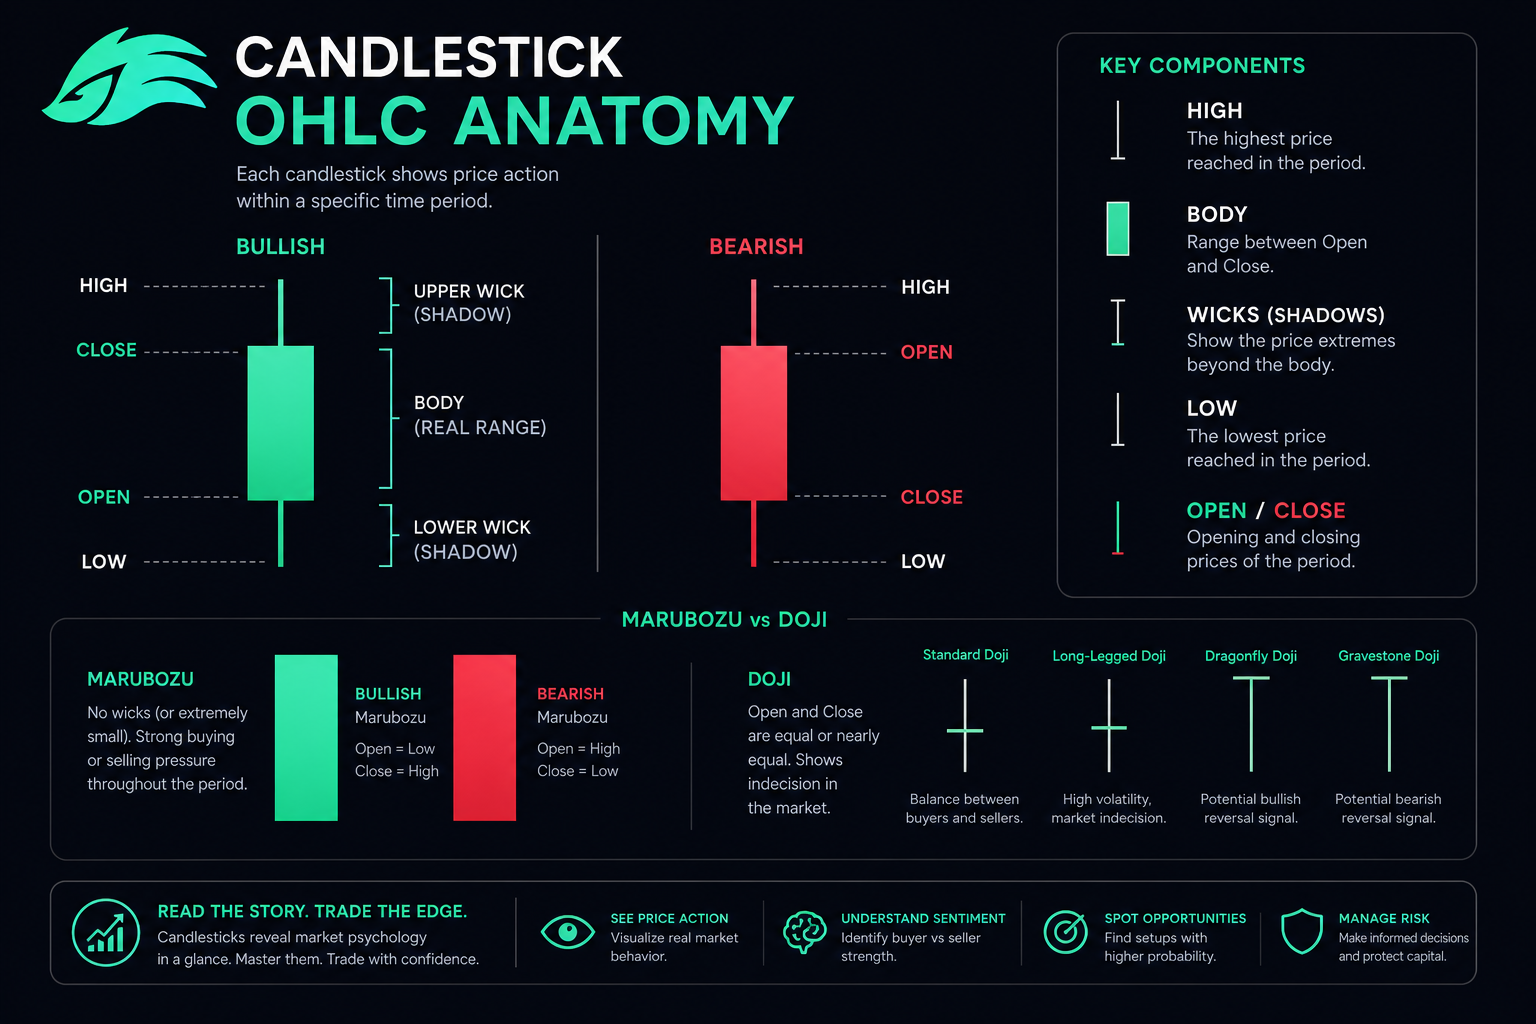
The Anatomy of a Candlestick
Every candlestick tells a story about what happened during one specific time period (1 minute, 1 hour, 1 day, etc.).
The Four Prices Every Candle Shows
Open: The price at the start of the period. Where the candle "begins."
Close: The price at the end of the period. Where the candle "ends."
High: The highest price reached during the period.
Low: The lowest price reached during the period.
These four prices are called OHLC (Open, High, Low, Close) — universal trader shorthand.
The Body and the Wicks
The body is the rectangular section between open and close. The body shows the net price movement during the period.
- Tall body: Strong directional movement (buyers or sellers dominated)
- Small body: Indecision, balanced buying and selling
- No body (or very thin): Open and close at nearly the same price (doji)
The wicks (also called "shadows" or "tails") are the thin lines extending above and below the body. They show how far price traveled during the period before settling at the close.
- Long upper wick: Price tried to push higher but sellers pushed it back down. Bearish signal.
- Long lower wick: Price tried to push lower but buyers pushed it back up. Bullish signal.
- No wicks (marubozu): Open and close were at the extremes. Very strong directional conviction.
Color Conventions
Green (or white) candle: Close higher than open. Price went up during the period. Bullish.
Red (or black) candle: Close lower than open. Price went down during the period. Bearish.
Some platforms let you customize colors. The principle is universal regardless of color choice.
Reading a Candle in 5 Seconds
For any candle you see:
- Color → Did price go up or down during this period?
- Body size → How strong was the directional move?
- Upper wick → How much did sellers reject higher prices?
- Lower wick → How much did buyers reject lower prices?
- Position relative to recent candles → Is this consistent with the trend?
These five observations unlock 90% of what candlestick reading provides.
Time Frames: Reading the Same Story at Different Zoom Levels
Crucial concept: the same market can look bullish on one timeframe and bearish on another.
Common timeframes used in crypto:
- 1-minute (1m): Scalpers only — extreme noise
- 5-minute (5m): Day trading micro-timing
- 15-minute (15m): Day trading entries
- 1-hour (1h): Intraday trend
- 4-hour (4h): Swing trading workhorse
- Daily (1D): Position trading, broader trend
- Weekly (1W): Macro trend, long-term picture
- Monthly (1M): Multi-year cycles
The crucial insight: Higher timeframes are more reliable than lower ones. A bullish pattern on the daily chart carries more weight than a bullish pattern on the 5-minute chart.
Practical rule: Determine the trend on a higher timeframe before looking for entries on a lower timeframe. If the daily chart shows a downtrend, taking long signals on the 15-minute chart is fighting the bigger picture.
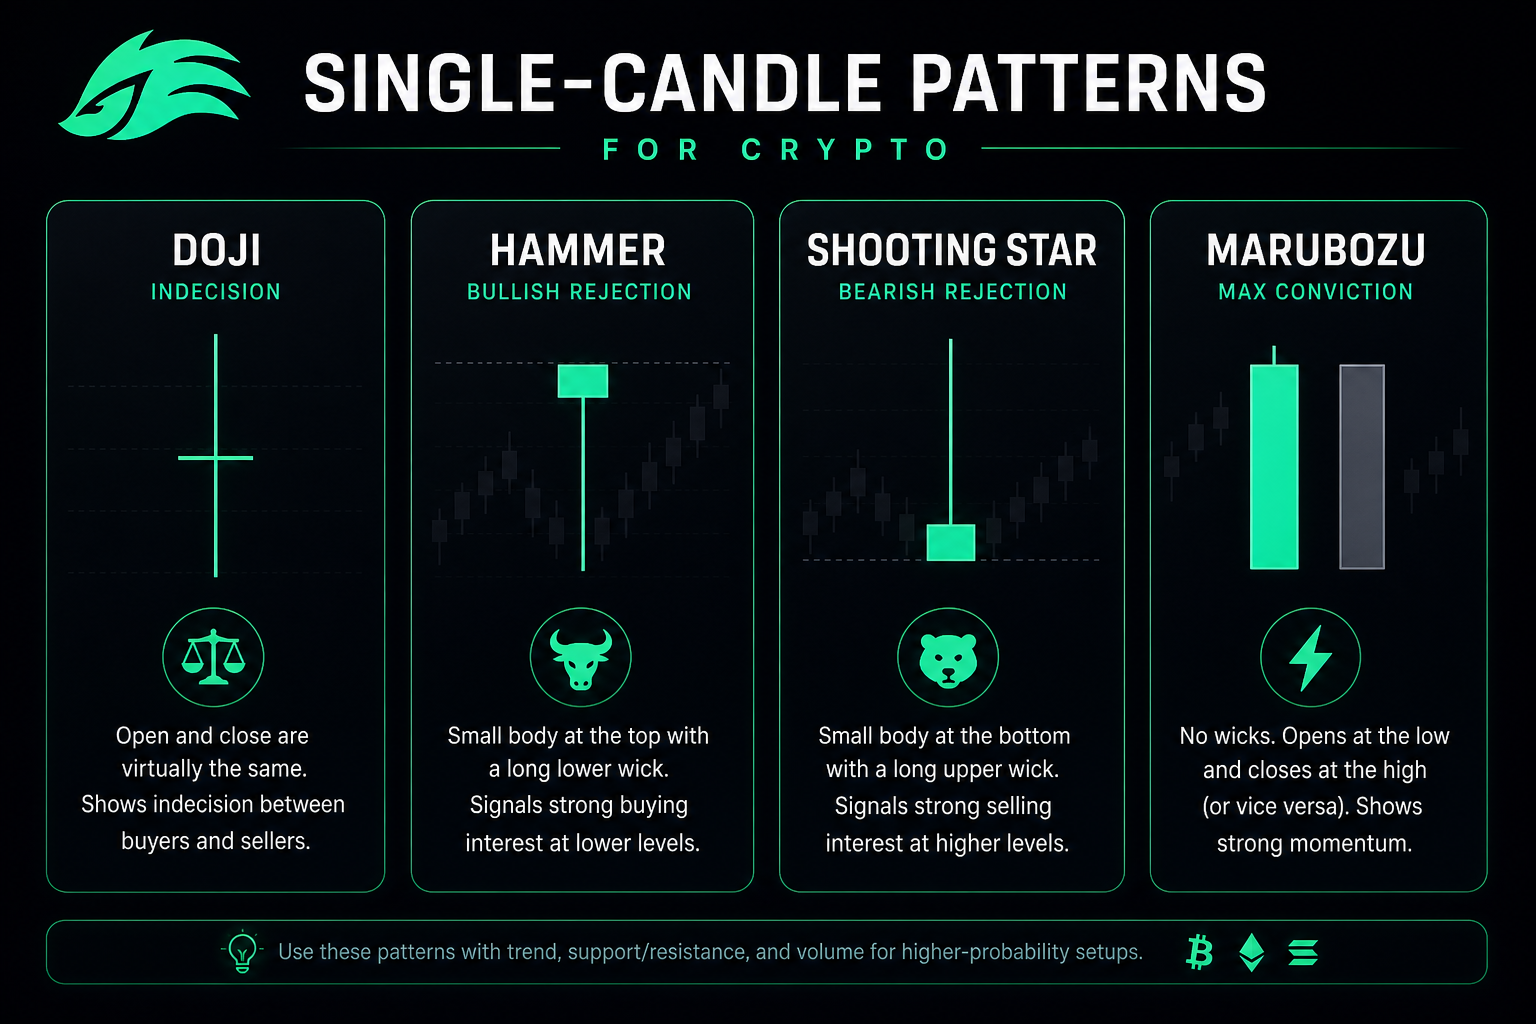
Single-Candle Patterns That Matter
Some candles, on their own, contain meaningful information.
Doji — Indecision
What it looks like: Open and close at essentially the same price. The body is tiny or non-existent. Wicks can be of any length.
What it means: Buyers and sellers fought to a draw. Indecision.
When it matters: At the end of a strong trend. A doji after a long uptrend often signals exhaustion and potential reversal. A doji after a long downtrend often signals selling capitulation.
When it doesn't matter: In the middle of a range. Indecision in already-undecided markets is meaningless.
Hammer — Bullish Rejection
What it looks like: Small body at the top of the range, with a long lower wick at least 2× the body length.
What it means: Price dropped significantly during the period but buyers pushed it back up by the close. Strong rejection of lower prices.
When it matters: After a downtrend, at potential support levels. Hammers at key support often mark bottoms.
Variation: "Hanging man" looks identical but appears at the top of uptrends — and is bearish, not bullish. Context matters.
Shooting Star — Bearish Rejection
What it looks like: Small body at the bottom of the range, with a long upper wick at least 2× the body length.
What it means: Price spiked significantly during the period but sellers pushed it back down by the close. Strong rejection of higher prices.
When it matters: After an uptrend, at potential resistance levels. Shooting stars at key resistance often mark tops.
Marubozu — Maximum Conviction
What it looks like: Large body with no (or minimal) wicks. Open at one extreme, close at the other.
What it means: Overwhelming directional conviction. Buyers (green) or sellers (red) dominated the entire period.
When it matters: Breakouts from consolidation. A bullish marubozu breaking through resistance suggests strong continuation. A bearish marubozu breaking support suggests strong continuation down.
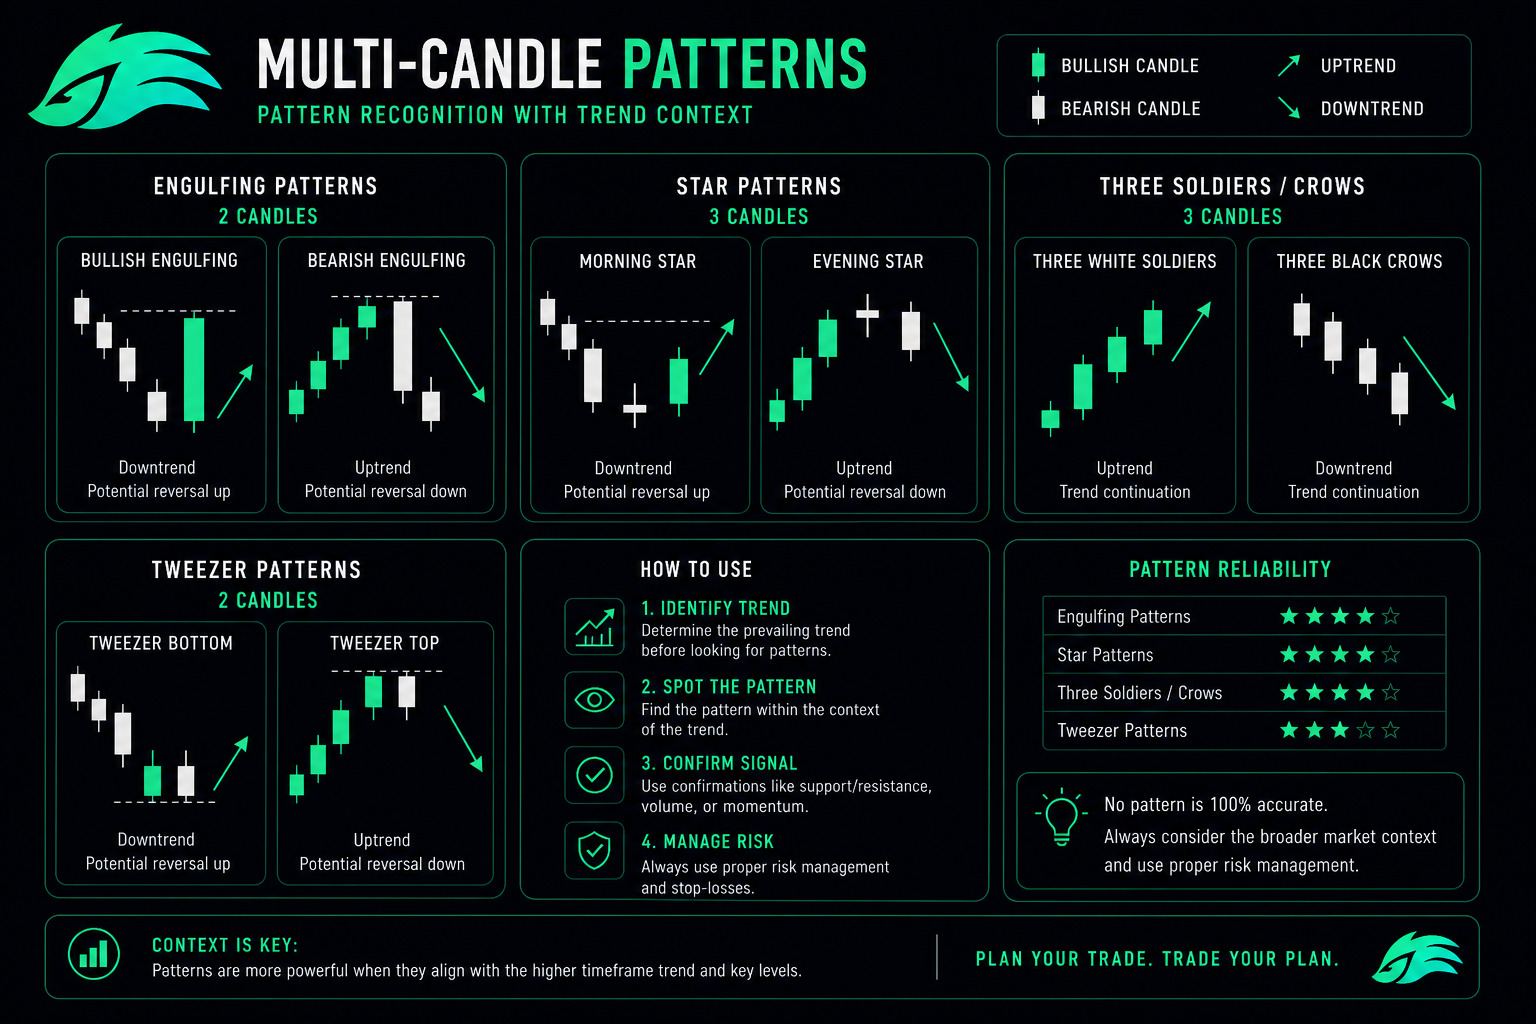
Multi-Candle Patterns That Actually Work
Combinations of 2-5 candles create higher-confidence signals than single candles.
Bullish Engulfing — Reversal at Bottoms
What it looks like: A small red candle followed by a large green candle that completely "engulfs" the red one's body.
What it means: Sellers were in control briefly, but buyers came in with overwhelming force. Strong bullish reversal signal.
When it matters: After a downtrend, at support levels. Bullish engulfing patterns at the right context are among the most reliable reversal signals.
Bearish Engulfing — Reversal at Tops
What it looks like: A small green candle followed by a large red candle that completely engulfs the green one's body.
What it means: Buyers were in control briefly, but sellers came in with overwhelming force. Strong bearish reversal signal.
When it matters: After an uptrend, at resistance levels.
Morning Star — Three-Candle Bullish Reversal
What it looks like: Large red candle → small-body candle (gap down or small) → large green candle. Three-candle pattern.
What it means: Selling exhausts (first candle), market pauses in indecision (second candle), buyers take over decisively (third candle). Strong reversal pattern.
When it matters: At market bottoms after extended downtrends.
Evening Star — Three-Candle Bearish Reversal
What it looks like: Large green candle → small-body candle → large red candle.
What it means: Buying exhausts, market pauses, sellers take over. Strong bearish reversal pattern.
When it matters: At market tops after extended uptrends.
Three White Soldiers — Strong Bullish Continuation
What it looks like: Three consecutive large green candles, each closing higher than the previous.
What it means: Sustained buying pressure. Strong upward conviction.
When it matters: Breakouts from consolidation or accumulation zones. Confirms the start of new uptrends.
Three Black Crows — Strong Bearish Continuation
What it looks like: Three consecutive large red candles, each closing lower than the previous.
What it means: Sustained selling pressure. Strong downward conviction.
When it matters: Breakdown patterns or the start of new downtrends.
Tweezer Tops / Bottoms — Double Rejection
What it looks like: Two consecutive candles with matching highs (tweezer top) or matching lows (tweezer bottom).
What it means: Two attempts to push through a level, both rejected. Strong level holding.
When it matters: At established support/resistance levels.
Context Is Everything: Where Patterns Matter Most
The single biggest mistake beginners make: trading patterns without context.
Where Patterns Work Best
1. At significant support or resistance levels. A bullish engulfing at major support is a high-probability setup. The same pattern in the middle of a range is noise.
2. After extended trends (for reversals). Reversal patterns after a long sustained move have higher win rates than in choppy markets.
3. At round numbers and psychological levels. $100K BTC, $4K ETH, $200 SOL — major round numbers often coincide with pattern formation.
4. With volume confirmation. Patterns formed on high volume are more reliable than the same patterns on thin volume.
5. Aligned with higher timeframe trend (for continuation patterns). Bullish continuation patterns work best in confirmed uptrends.
Where Patterns Fail
1. In the middle of ranges. Random patterns in undecided markets mean nothing.
2. Against the higher timeframe trend. Bullish reversal patterns during strong downtrends often fail.
3. Without volume. Patterns on low volume are often coincidental.
4. In low-liquidity assets. Small-cap memecoins can show "perfect" patterns that are actually just one or two large traders manipulating thin order books.
5. After many failed attempts. A pattern that has formed multiple times at the same level without working is becoming less reliable.
How to Practice Candlestick Reading
Pattern recognition is a skill — and like all skills, it requires deliberate practice.
Step 1: Pick 2-3 major assets. Bitcoin, Ethereum, Solana. Clean charts with reliable patterns.
Step 2: Start with daily charts. Less noise, more reliable patterns. Move to lower timeframes only after mastering higher ones.
Step 3: Identify patterns retrospectively. Open old charts. Find historical examples of each pattern type. Note context — where they appeared, whether they worked.
Step 4: Maintain a pattern journal. For each pattern you find, document: date, asset, timeframe, context (trend, level), pattern type, what happened next. Build a personal database.
Step 5: Forward-test. Identify potential patterns forming in real-time but don't trade yet. Mark predictions. Check results after the fact.
Step 6: Start trading tiny. Once you've demonstrated pattern recognition without money on the line, start with positions so small that losses don't matter emotionally.
Step 7: Review every trade. Was the pattern valid? Did context support it? Was your entry/exit appropriate? What did you learn?
True candlestick fluency typically takes 6-12 months of focused practice. Most beginners give up before reaching it.
Practice candlestick reading with live Solana charts on GraphDex
Common Beginner Mistakes With Candlestick Patterns
For balance, the patterns that destroy new traders:
1. Trading every pattern you see. Selectivity wins. Focus on high-context setups, not every shape you recognize.
2. Ignoring the higher timeframe. A bullish pattern on the 15-minute chart against a daily downtrend is a low-probability trade.
3. Skipping volume. Pattern + no volume = weak signal. Always check the volume bars beneath patterns.
4. Memorizing 50+ patterns. The 10-15 patterns covered above account for 90% of useful candlestick analysis. Don't dilute your focus.
5. Pattern fitting. Seeing patterns that aren't there because you want to take a trade. Most candle formations aren't tradeable patterns.
6. Trading immediately on pattern formation. Wait for confirmation — close of the pattern candle, then often a confirmation candle next.
7. No stop loss. Even high-probability patterns fail 30-40% of the time. Always have a defined invalidation point.
8. Treating signals as certainties. A "perfect" hammer at support still fails sometimes. Patterns shift probabilities — they don't guarantee outcomes.
Read live candlesticks on GraphDex Solana terminal
How GraphDex Supports Candlestick-Based Trading
For active Solana traders applying candlestick analysis:
- Multi-timeframe live charts with full OHLC data
- Volume integration showing volume bars beneath price action
- Bubble Maps combining technical signals with on-chain holder analysis
- Pulse feed surfacing new tokens forming early patterns
- AI signals identifying high-context setups
- MEV protection preventing sandwich attacks on entry/exit
- Fee-based 17% APY staking on stablecoins between trades
- Non-custodial Privy wallet — sign in with Twitter, email, or Telegram
The integrated approach means your charts, analysis, and execution all happen in one place — reducing the context-switching that breaks pattern-trading focus.
Frequently Asked Questions
What is a candlestick chart in crypto? A candlestick chart shows price action over time using rectangular candles. Each candle represents one time period (1 minute, 1 hour, 1 day, etc.) and shows four prices: open, high, low, and close. Candlesticks are the universal language of trading — used across stocks, forex, commodities, and crypto.
How do you read a candlestick? Five quick observations: (1) Color — green = price up, red = price down; (2) Body size — large = strong move, small = indecision; (3) Upper wick — longer means sellers rejected higher prices; (4) Lower wick — longer means buyers rejected lower prices; (5) Position relative to recent candles and key levels.
What are the most important candlestick patterns? The 10-15 patterns that matter most: doji (indecision), hammer (bullish rejection), shooting star (bearish rejection), bullish/bearish engulfing (reversal), morning/evening star (3-candle reversal), three white soldiers/black crows (strong continuation), tweezer tops/bottoms (double rejection), marubozu (maximum conviction). Master these before exploring obscure patterns.
Do candlestick patterns work in crypto? Yes, often better than in traditional markets. Crypto markets are dominated by retail traders, social momentum, and 24/7 trading — conditions where collective psychology creates clear patterns. Patterns work best at significant support/resistance levels with volume confirmation. They fail in random market noise.
What timeframe should I use for candlesticks? Match timeframe to your trading style. Beginners should start with daily charts — less noise, more reliable patterns. Day traders use 5min-4 hour. Position traders use daily-weekly. The key principle: higher timeframes are more reliable than lower ones. Always confirm patterns across multiple timeframes.
What's the difference between a hammer and a hanging man? They look identical — small body at the top of the range, long lower wick at least 2× body length. The difference is context: a hammer appears after a downtrend at support (bullish reversal signal), while a hanging man appears at the top of an uptrend (bearish reversal signal). Same shape, opposite implications based on context.
How long does it take to master candlestick reading? Basic recognition: a few weeks. Intermediate pattern recognition with context: 3-6 months of focused practice. True fluency where candlesticks drive consistent profits: 6-12 months minimum. Most beginners give up before reaching the fluency level — patience and journaling separate those who reach it.
About This Guide
This guide is published by the GraphDex Research team — analysts and traders building the infrastructure for digital asset trading on Solana. Our content is based on direct trading experience, current market data, and widely-accepted candlestick analysis principles.
Sources & data: Pattern descriptions reflect standard candlestick analysis as practiced in 2026. Candlestick patterns provide probabilistic edges, not guarantees — all trading carries risk of loss. This guide is educational and not financial advice.
GraphDex is the infrastructure for digital asset trading — trade, predict, and earn in one place. Learn more at graphdex.io.
Last reviewed: May 2026 · GraphDex Research
The infrastructure for digital asset trading. Trade, predict, stake, repeat. graphdex.io