By GraphDex Research · Reviewed for accuracy May 2026
Quick Answer
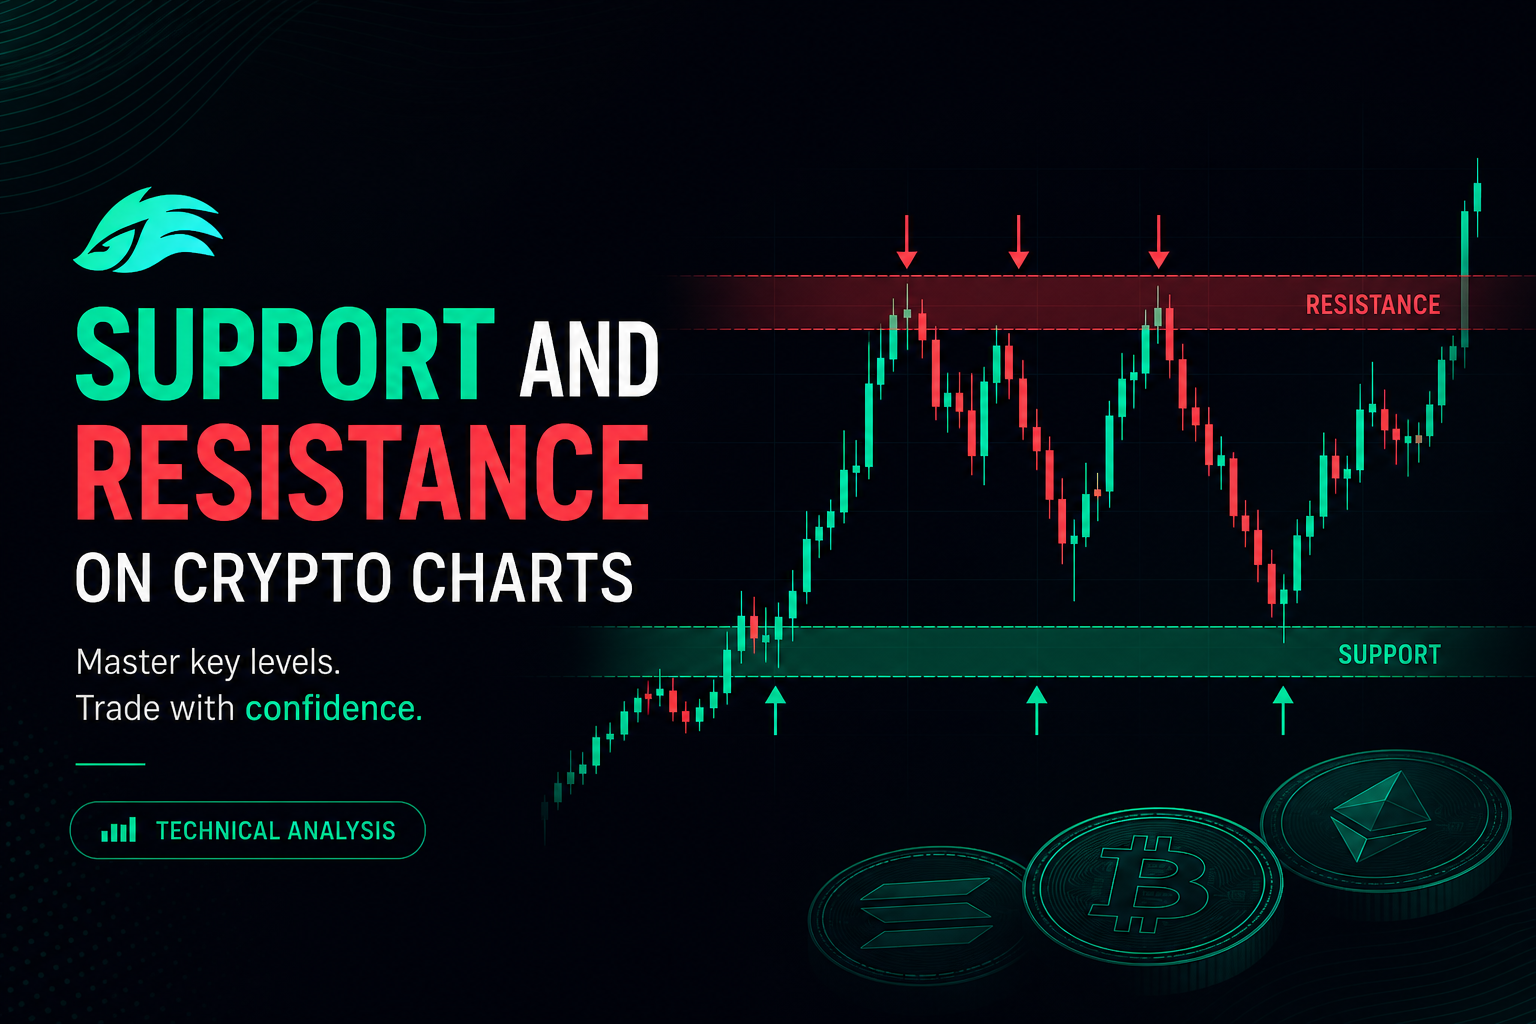
Support and resistance are price levels where buying or selling pressure tends to halt or reverse price movements:
- Support: A "floor" where buying interest is strong enough to prevent further declines
- Resistance: A "ceiling" where selling interest is strong enough to prevent further advances
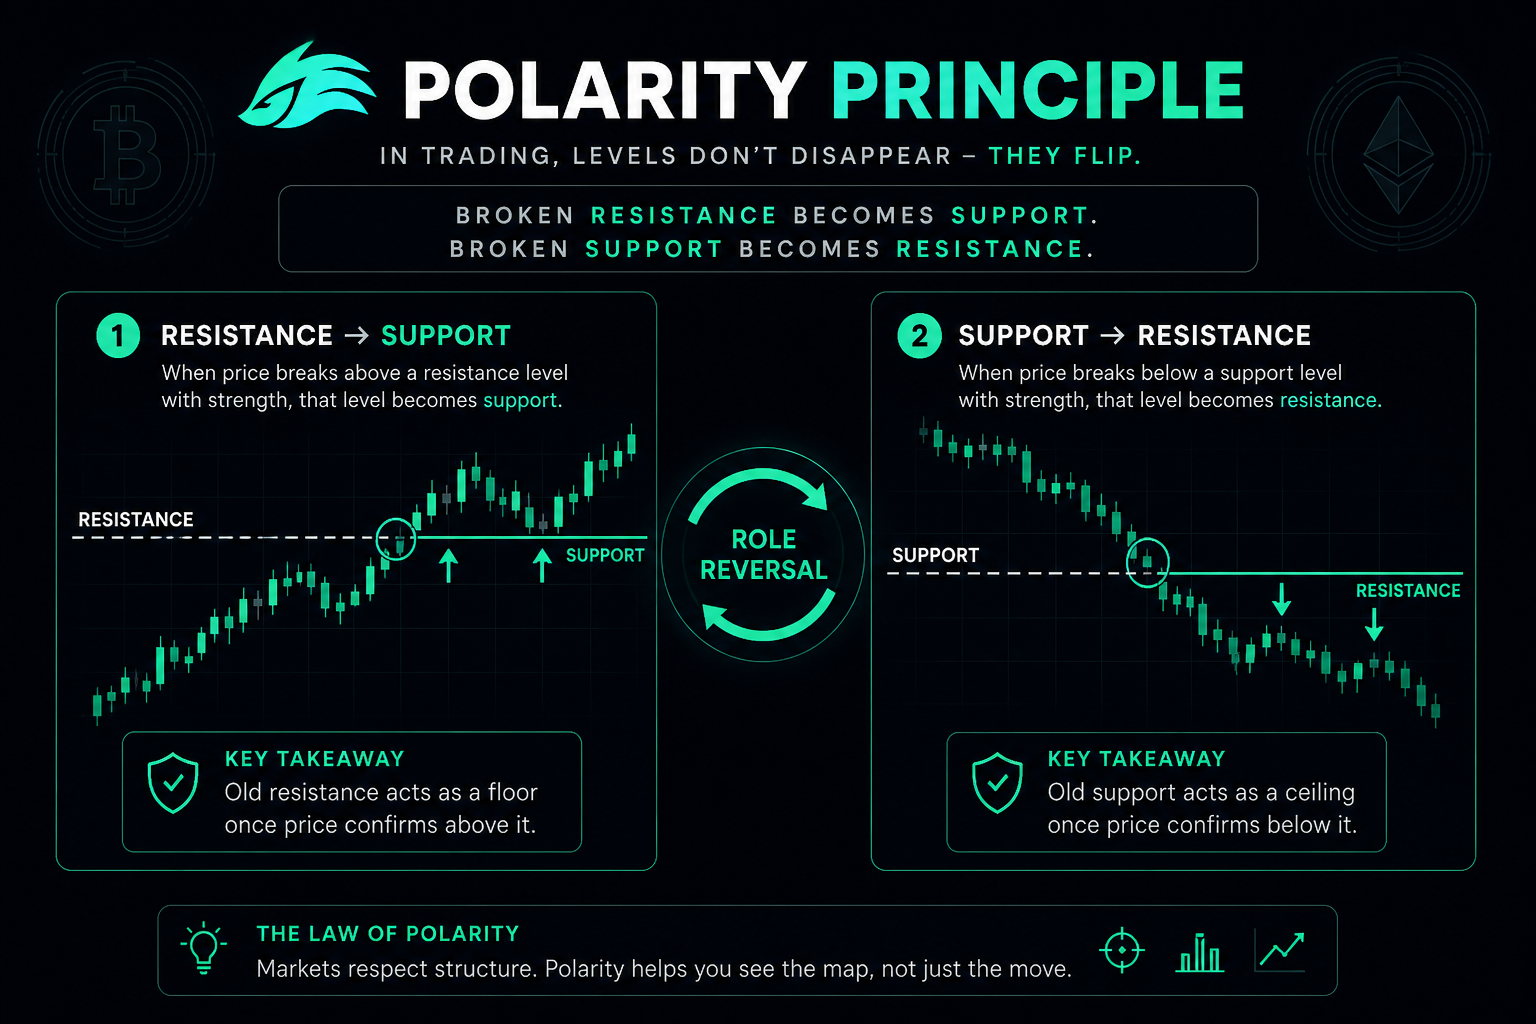
- Polarity principle: Broken support often becomes resistance; broken resistance often becomes support
- Types: Horizontal levels, trendlines, moving averages, round numbers, Fibonacci levels
- Strength factors: Number of touches, time, volume at the level, age of the level
- Best trades: Bounces off support (longs) and rejections at resistance (shorts) with stop-losses just beyond
The honest truth: S/R levels are zones, not exact prices. Treating them as precise lines causes losses; treating them as zones (with confluence) creates edges.
Trade Solana S/R with live charts on GraphDex
Key Takeaways
- Support is where buyers emerge; resistance is where sellers emerge. The market has memory.
- Broken levels often flip polarity — old resistance becomes new support, and vice versa.
- The more times a level has been tested, the more significant it becomes.
- Treat S/R as zones (3-5% wide on volatile assets), not exact price lines.
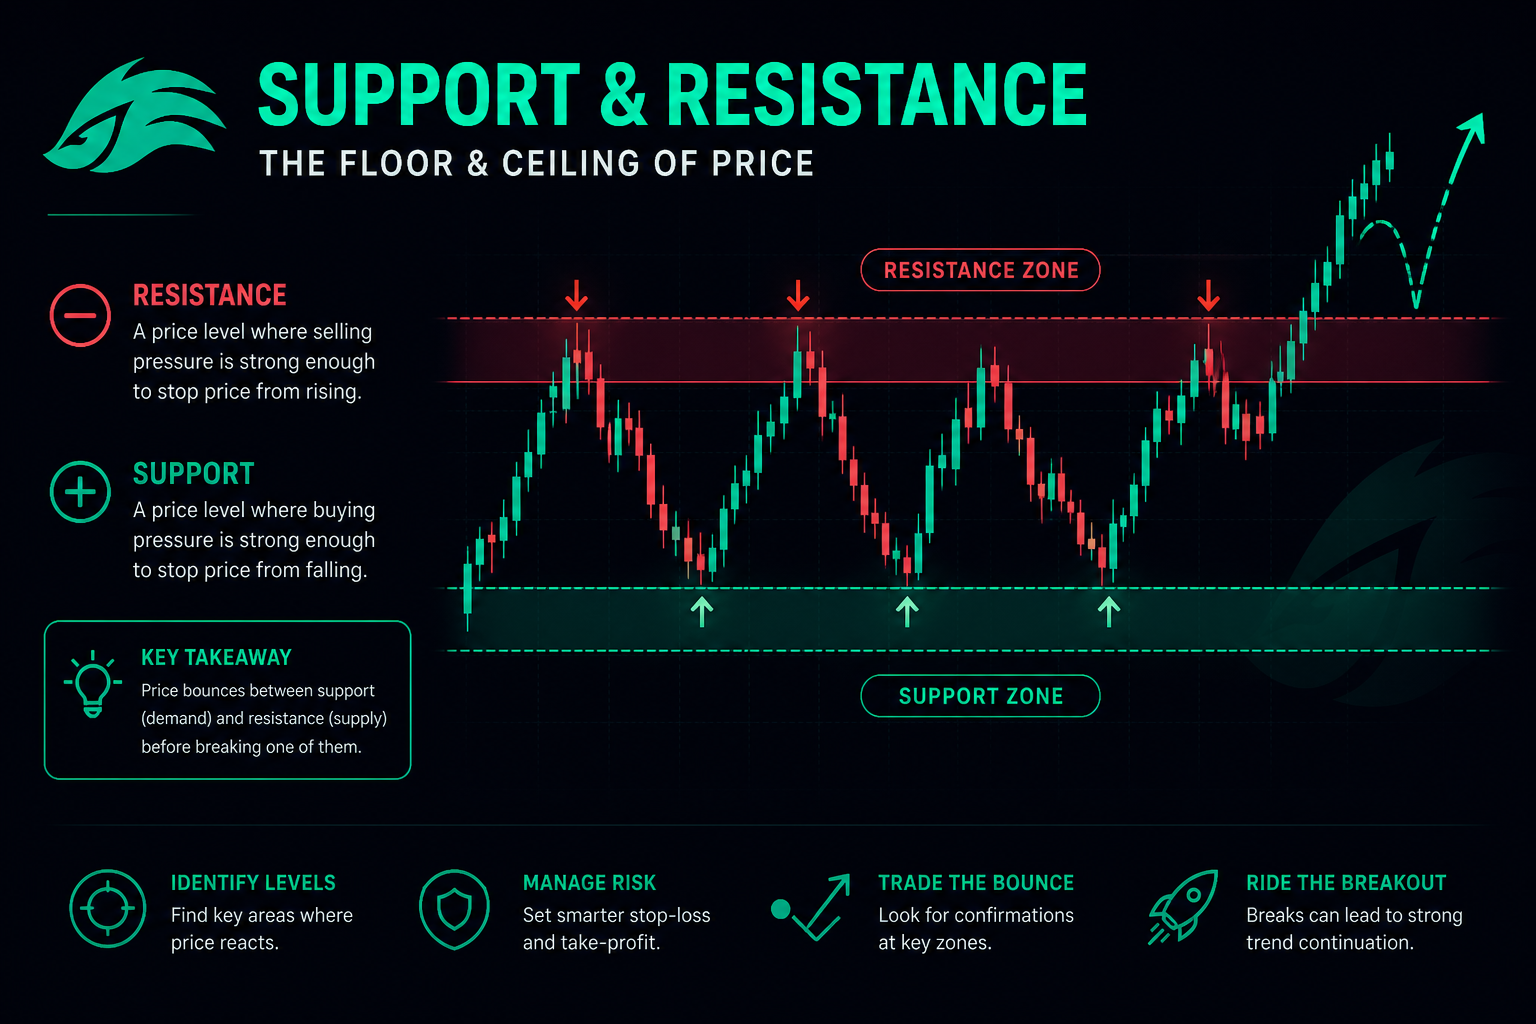
What Are Support and Resistance?
Support and resistance are price levels (or zones) where market participants have historically reacted strongly enough to halt or reverse price movements. They're the foundation of nearly all technical analysis — and arguably the single most important concept in trading.
Support: The Floor
Support is a price level where buying interest has been (or is expected to be) strong enough to prevent further declines. Think of it as a floor — price falls toward it, hits resistance from buyers, and bounces back up.
Why support forms:
- Traders who missed earlier entries place buy orders here
- Holders who previously bought at this level defend their positions
- Algorithms and institutions place limit orders around significant levels
- The psychology of "this is a good price" becomes self-fulfilling
Resistance: The Ceiling
Resistance is a price level where selling interest has been (or is expected to be) strong enough to prevent further advances. Think of it as a ceiling — price rises toward it, hits selling pressure, and turns back down.
Why resistance forms:
- Traders who bought higher and now see profits sell to lock in gains
- Underwater holders from previous peaks "exit at breakeven" as price reaches their entry
- Short sellers initiate positions at perceived overvalued levels
- Algorithms and institutions place sell orders around significant levels
The Critical Insight: Polarity
Broken support often becomes resistance. Broken resistance often becomes support.
This is called "polarity" — and it's one of the most reliable concepts in technical analysis.
Why? When price breaks below support, the people who bought at that level are now underwater. As price rises back to their entry, they sell to break even, creating selling pressure (resistance). The reverse applies to broken resistance.
This polarity principle creates predictable trading opportunities and is the basis of countless successful strategies.
Types of Support and Resistance
Support and resistance aren't limited to horizontal lines. They come in several forms.
Horizontal Levels
The most common type. Drawn at obvious previous highs, lows, and consolidation areas.
How to identify:
- Mark previous swing highs and lows
- Look for areas where price reversed multiple times
- Identify consolidation zones (price ranged within a small area)
Strength factors:
- Multiple touches: More tests = stronger level
- Recency: Recent levels often more relevant than ancient ones
- Volume: Levels formed on high volume are stronger
- Reaction strength: Sharp reversals = strong levels
Trendlines
Dynamic support/resistance lines drawn along the path of trending price action.
Uptrend line: Connects consecutive higher lows. Acts as dynamic support.
Downtrend line: Connects consecutive lower highs. Acts as dynamic resistance.
Rules for valid trendlines:
- At least 3 touch points (more is better)
- The more touches, the stronger the trendline
- Breaks of major trendlines often signal trend changes
- Steeper trendlines are less reliable than gradual ones
Moving Averages
Many traders use moving averages (especially 50, 100, and 200-period MAs) as dynamic support/resistance.
Why MAs work as S/R: They're widely watched. When enough traders use a level as a decision point, it becomes self-fulfilling.
Common practice:
- 20 EMA = short-term S/R in trends
- 50 EMA = medium-term S/R
- 200 EMA = major long-term S/R (most-watched globally)
Round Numbers
Major round prices act as psychological support/resistance due to clustering of orders.
Examples: $100,000 BTC, $5,000 ETH, $200 SOL, $1.00 stablecoins, $0.01 (penny) levels for memecoins.
Why they work: Humans naturally place orders at round numbers. "Sell at $200" or "buy at $100" are easier mental commitments than "$197.45." This clustering creates real support/resistance.
Fibonacci Levels
Retracement levels (38.2%, 50%, 61.8%) derived from the Fibonacci sequence. Highly watched, especially the 61.8% "golden ratio."
Volume Profile Levels
Areas with heavy historical trading volume act as future support/resistance. The "point of control" (POC) — the price with the most trading volume in a period — is often the strongest level.
How to Draw Support and Resistance
Drawing S/R is part science, part art. Practical approach:
Step 1: Zoom Out
Start with higher timeframes — weekly and daily charts. Major levels visible on higher timeframes are more important than levels only visible on lower timeframes.
Step 2: Identify Major Highs and Lows
Mark the obvious peaks and troughs. These are starting points for major levels.
Step 3: Look for Confluence
The strongest levels are where multiple factors align:
- Previous high/low + round number
- Trendline + moving average
- Fibonacci level + volume profile node
- Major support from years ago + recent resistance
When 3+ factors align at the same price, that level is significantly stronger than any one factor alone.
Step 4: Treat Levels as Zones
This is critical. A "support level" isn't $100 exactly — it's typically $98-$102 (a zone).
For volatile crypto assets, zones can be 3-5% wide. For Bitcoin around $100,000, "support at $100K" might mean $97,500-$102,500.
Step 5: Update Levels as Price Action Develops
Old levels become less relevant as new ones form. The 2021 ATH may matter less now than levels formed in the last 6 months. Keep your chart clean — too many lines obscure rather than clarify.
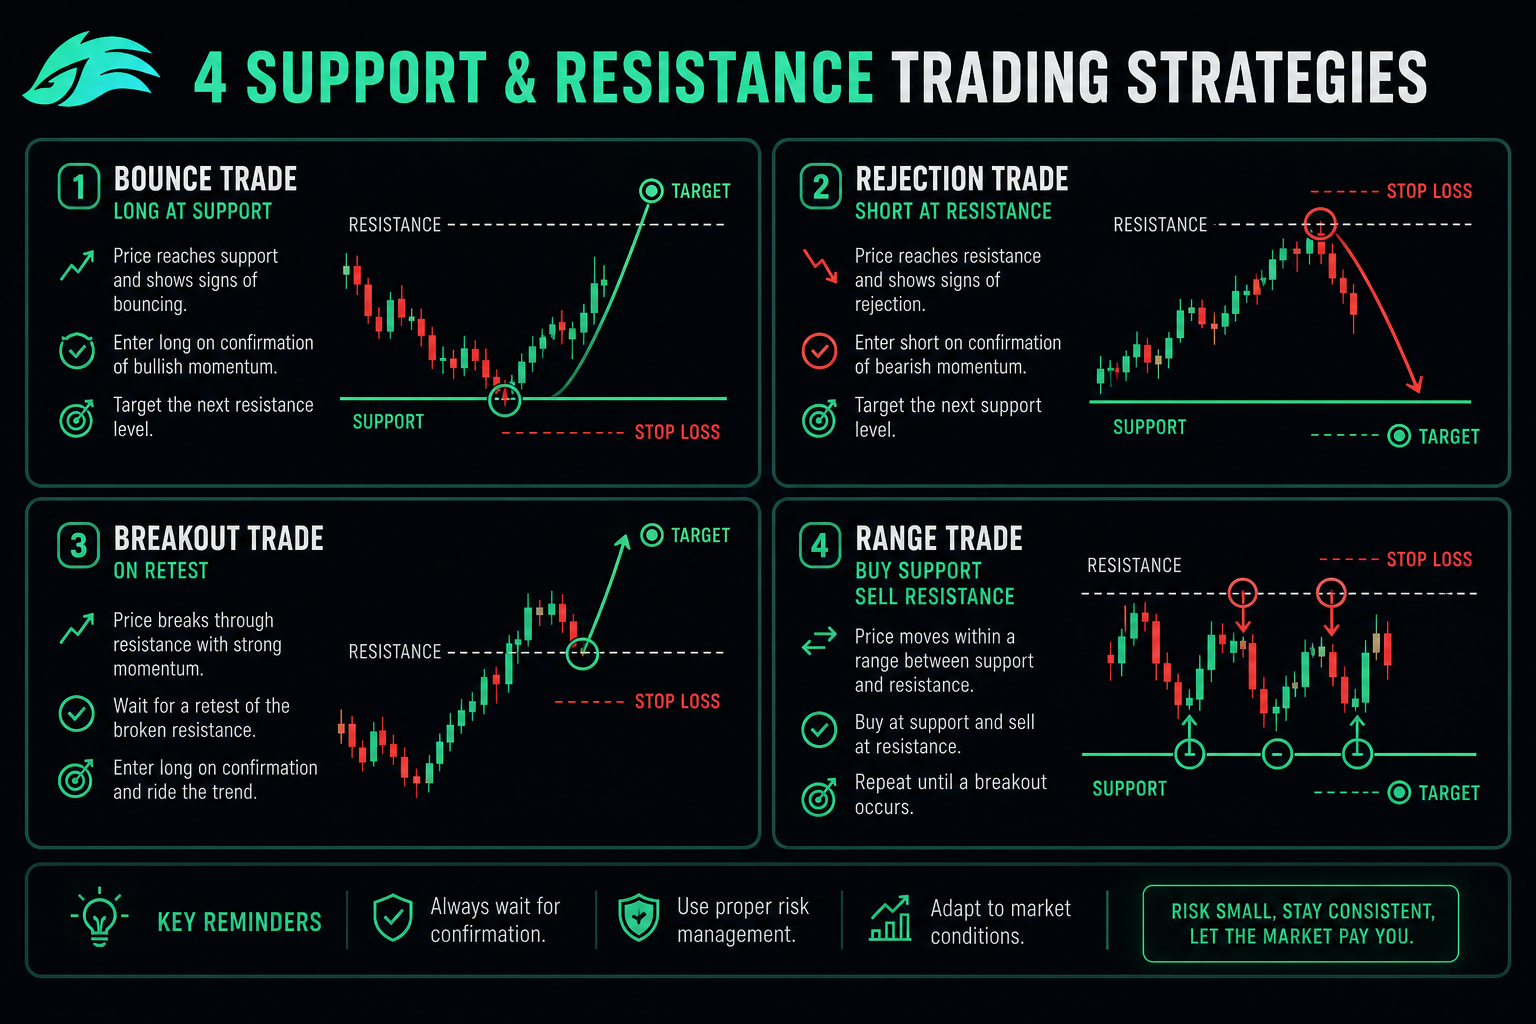
How to Trade Support and Resistance
The practical application is what generates profits.
The Classic Bounce Trade
The setup: Price approaches a significant support level with clear historical reaction.
The entry: Buy near support with a bullish reversal signal (hammer, bullish engulfing, divergence).
The stop loss: Just below the support zone (not exact level — leave room for noise).
The target: Next resistance level above. Risk-reward should be at least 2:1.
Win rate: Properly executed support bounces typically achieve 55-65% win rates.
Apply S/R bounce trades on GraphDex Solana terminal
The Rejection Trade (At Resistance)
The setup: Price approaches a significant resistance level after a rally.
The entry: Sell or short near resistance with a bearish reversal signal.
The stop loss: Just above the resistance zone.
The target: Next support level below.
The Breakout Trade
The setup: Price breaks decisively through a significant resistance (or below support) with volume.
The entry: After the break, often on a retest of the broken level (which now acts as support).
The stop loss: Just below the broken level (now support).
The target: Measured move based on the previous range height.
Important: Many breakouts fail. Wait for confirmation (close above the level, retest holding) before committing significant capital.
The Range Trade
The setup: Price is oscillating between clear support and resistance levels.
The entry: Buy near support, sell near resistance.
The stop loss: Beyond the opposite side of the range.
Best for: Crypto sideways markets, common between major directional moves.
What Makes a Level Strong?
Not all support and resistance levels are equal. Strength factors:
1. Number of touches: A level tested 4-5 times is much stronger than one tested twice. Each successful test reinforces the level.
2. Time: Older levels generally less relevant than recent ones, BUT major historical levels (like all-time highs) can remain significant for years.
3. Volume at the level: Levels formed with heavy volume are stronger than those formed with thin volume.
4. Reaction strength: Sharp reversals indicate strong reactions; weak bounces indicate weak levels.
5. Confluence with other factors: Round number + previous high + Fibonacci = much stronger than any one factor alone.
6. Higher-timeframe visibility: Levels visible on weekly and monthly charts are stronger than levels only on hourly charts.
7. Recent test: A level recently tested and held is more relevant than one untested for months.
Common Mistakes With Support and Resistance
For balance, the patterns that destroy traders using S/R:
1. Treating levels as exact prices. S/R are zones. Buying exactly at $100 with a stop at $99.50 will get stopped out frequently. Use zones with sensible buffers.
2. Drawing too many levels. A chart with 15 lines is useless. Stick to 3-5 major levels per timeframe.
3. Ignoring higher timeframes. Trading off 15-minute S/R while ignoring daily S/R is fighting the bigger picture.
4. No volume confirmation. Breakouts without volume often fail. Always check volume context.
5. Trading every level. Selectivity wins. Not every level deserves a trade — focus on high-confluence setups.
6. Stop losses too tight. Crypto is volatile. Stops just outside levels often get hit by noise. Give trades room to work.
7. Holding through level breaks. When a level breaks decisively (close beyond, volume confirms), the trade thesis is invalidated. Exit instead of hoping.
8. Ignoring polarity. Forgetting that broken support becomes resistance leads to losses on retests.
Support and Resistance in Memecoins vs Major Assets
Important caveat: S/R works differently in different markets.
In Major Assets (BTC, ETH, SOL)
- Clear, reliable S/R levels with strong historical data
- Volume confirms moves predictably
- Patterns work well due to deep liquidity
- Multi-timeframe analysis is highly effective
In Memecoins and Low-Cap Tokens
- S/R levels less reliable due to low liquidity
- Single large traders can override "levels"
- Patterns can be manufactured (wash trading)
- Combine S/R with on-chain analysis (Bubble Maps for holder distribution)
- Use shorter timeframes due to short token lifespans
For memecoin trading specifically, combine traditional S/R with:
- Holder concentration (avoid tokens with massive holder concentration)
- Bonding curve graduation points on Pump.fun (~$69K mcap)
- Initial liquidity depths
- Social momentum patterns
How to Practice Support and Resistance
Like all TA, S/R is a skill requiring deliberate practice.
Step 1: Pick 2-3 major assets. Focus on BTC, ETH, SOL. Clean liquid markets with clear patterns.
Step 2: Start with daily charts. Less noise, more reliable levels.
Step 3: Mark major levels retrospectively. Identify clear historical S/R on past charts. Note what made them strong.
Step 4: Predict future reactions. Mark levels you expect price to react to. Track results.
Step 5: Combine with candlesticks. S/R + bullish reversal candle at support = high-probability long. S/R alone is weaker than S/R + confirmation.
Step 6: Trade tiny first. Start with positions so small that losses don't matter emotionally.
Step 7: Journal trades. Why did you take it? What level? What confluence? What happened? Lessons?
True S/R fluency typically takes 3-6 months of focused practice — faster than most TA skills because the concept is fundamentally simple.
Apply S/R on integrated Solana terminal — GraphDex
How GraphDex Supports S/R-Based Trading
For active Solana traders using support and resistance:
- Multi-timeframe charts for confluence analysis
- Volume profile integration showing high-volume nodes
- Bubble Maps combining S/R with holder distribution analysis
- Pulse feed surfacing new tokens forming early structure
- AI signals identifying high-context S/R setups
- MEV protection preventing sandwich attacks on level breakouts
- Fee-based 17% APY staking on stablecoins between trades
- Non-custodial Privy wallet — sign in with Twitter, email, or Telegram
Active Solana traders get professional charting with on-chain analysis integrated — no juggling between TradingView, Phantom, and a separate execution venue.
Frequently Asked Questions
What is support and resistance in crypto trading? Support is a price level where buying interest tends to halt declines (acts as a floor). Resistance is where selling interest tends to halt advances (acts as a ceiling). These are the foundational concepts of technical analysis — used by virtually every successful trader regardless of strategy.
How do you identify support and resistance levels? Start with higher timeframes (daily/weekly). Mark obvious previous highs and lows. Look for areas where price reversed multiple times. Identify round numbers and major Fibonacci levels. The strongest levels combine multiple factors (confluence) — old level + round number + Fibonacci + volume node.
What is the polarity principle? Broken support often becomes resistance, and broken resistance often becomes support. When a level breaks, traders who bought at that level (now underwater) tend to sell at breakeven as price returns — creating selling pressure at the old level. This is one of the most reliable TA concepts.
How do you trade support and resistance? Four main strategies: (1) Bounce trade — buy near support with reversal confirmation; (2) Rejection trade — sell near resistance with reversal confirmation; (3) Breakout trade — enter after decisive break with retest; (4) Range trade — buy support, sell resistance in sideways markets. All require defined stop losses and minimum 2:1 risk-reward ratios.
Are S/R levels exact prices or zones? Zones. Treating S/R as exact prices causes premature stop-outs from market noise. For crypto, zones typically span 3-5% on volatile assets. "Support at $100" might mean $97-$103 in practice. Build stop losses outside the entire zone with appropriate buffer.
How many S/R levels should I draw? 3-5 major levels per timeframe maximum. More lines obscure analysis rather than clarify it. Focus on highest-confluence levels with the strongest historical reactions. If your chart looks crowded, you're drawing too many.
Does S/R work in memecoins? Less reliably than in major assets. Memecoins have low liquidity, allowing single large traders to override "levels." Combine traditional S/R with on-chain analysis (holder distribution via Bubble Maps, bonding curve graduation points, initial liquidity). Use shorter timeframes due to short token lifespans.
About This Guide
This guide is published by the GraphDex Research team — analysts and traders building the infrastructure for digital asset trading on Solana. Our content is based on direct trading experience, current market data, and widely-accepted technical analysis principles.
Sources & data: S/R principles reflect standard technical analysis as practiced in 2026. Support and resistance provide probabilistic edges, not guarantees — all trading carries risk of loss. This guide is educational and not financial advice.
GraphDex is the infrastructure for digital asset trading — trade, predict, and earn in one place. Learn more at graphdex.io.
Last reviewed: May 2026 · GraphDex Research
The infrastructure for digital asset trading. Trade, predict, stake, repeat. graphdex.io