By GraphDex Research · Reviewed for accuracy May 2026
Quick Answer
Technical analysis (TA) is the study of price charts and trading volume to identify probable future price movements. It rests on three assumptions: market action discounts everything, prices move in trends, and history repeats itself. Core building blocks:
- Candlestick charts: Each candle shows open, close, high, low for a period
- Support and resistance: Price levels where buying or selling tends to emerge
- Trends: Higher highs/higher lows (uptrend), lower highs/lower lows (downtrend)
- Indicators: RSI (overbought/oversold), MACD (momentum), Moving Averages (trend)
- Chart patterns: Triangles, flags, head-and-shoulders, double tops/bottoms
- Multi-timeframe analysis: Confirm setups across different timeframes
The honest truth: TA gives probabilistic edges, not certainties. A 60% win rate is excellent. Master the basics before complex strategies.
Apply TA to Solana trading on GraphDex
Key Takeaways
- Technical analysis identifies probabilities, not certainties — even great setups lose 30-40% of the time.
- Master candlesticks, support/resistance, and trend identification before any indicators.
- 3-5 reliable indicators beat 15 indicators stacked on one chart.
- Multi-timeframe analysis (confirming on higher timeframes) substantially improves win rates.
What Is Technical Analysis?
Technical analysis (TA) is the practice of studying price charts and trading volume to forecast probable future price movements. Unlike fundamental analysis (which examines a project's underlying value), TA assumes that all relevant information is already reflected in price — and that recurring patterns in price action create predictable trading opportunities.
The three foundational assumptions of TA:
1. Market action discounts everything. Prices already reflect all known information — news, fundamentals, sentiment, supply/demand. So studying price action itself is sufficient.
2. Prices move in trends. Once established, a trend is more likely to continue than reverse. "The trend is your friend" is the oldest trading wisdom.
3. History repeats itself. Human psychology drives markets, and human psychology doesn't change. The same patterns of fear and greed produce similar chart formations across decades and assets.
Why TA works in crypto specifically: Crypto markets are dominated by retail traders, social momentum, and 24/7 trading — exactly the conditions where collective psychology creates clear patterns. TA arguably works better on crypto than on highly institutional stocks because there's less fundamental analysis competing with price action.
What TA isn't: It's not magic, prediction, or guarantee. Every TA setup can fail. Used properly, TA provides probabilistic edges (e.g., 55-65% win rates) that compound over many trades. Used poorly, it generates random noise that traders mistake for signals.
Candlestick Charts: The Trader's Language
Candlestick charts are the universal language of trading. Master these before anything else.
How a Candlestick Works
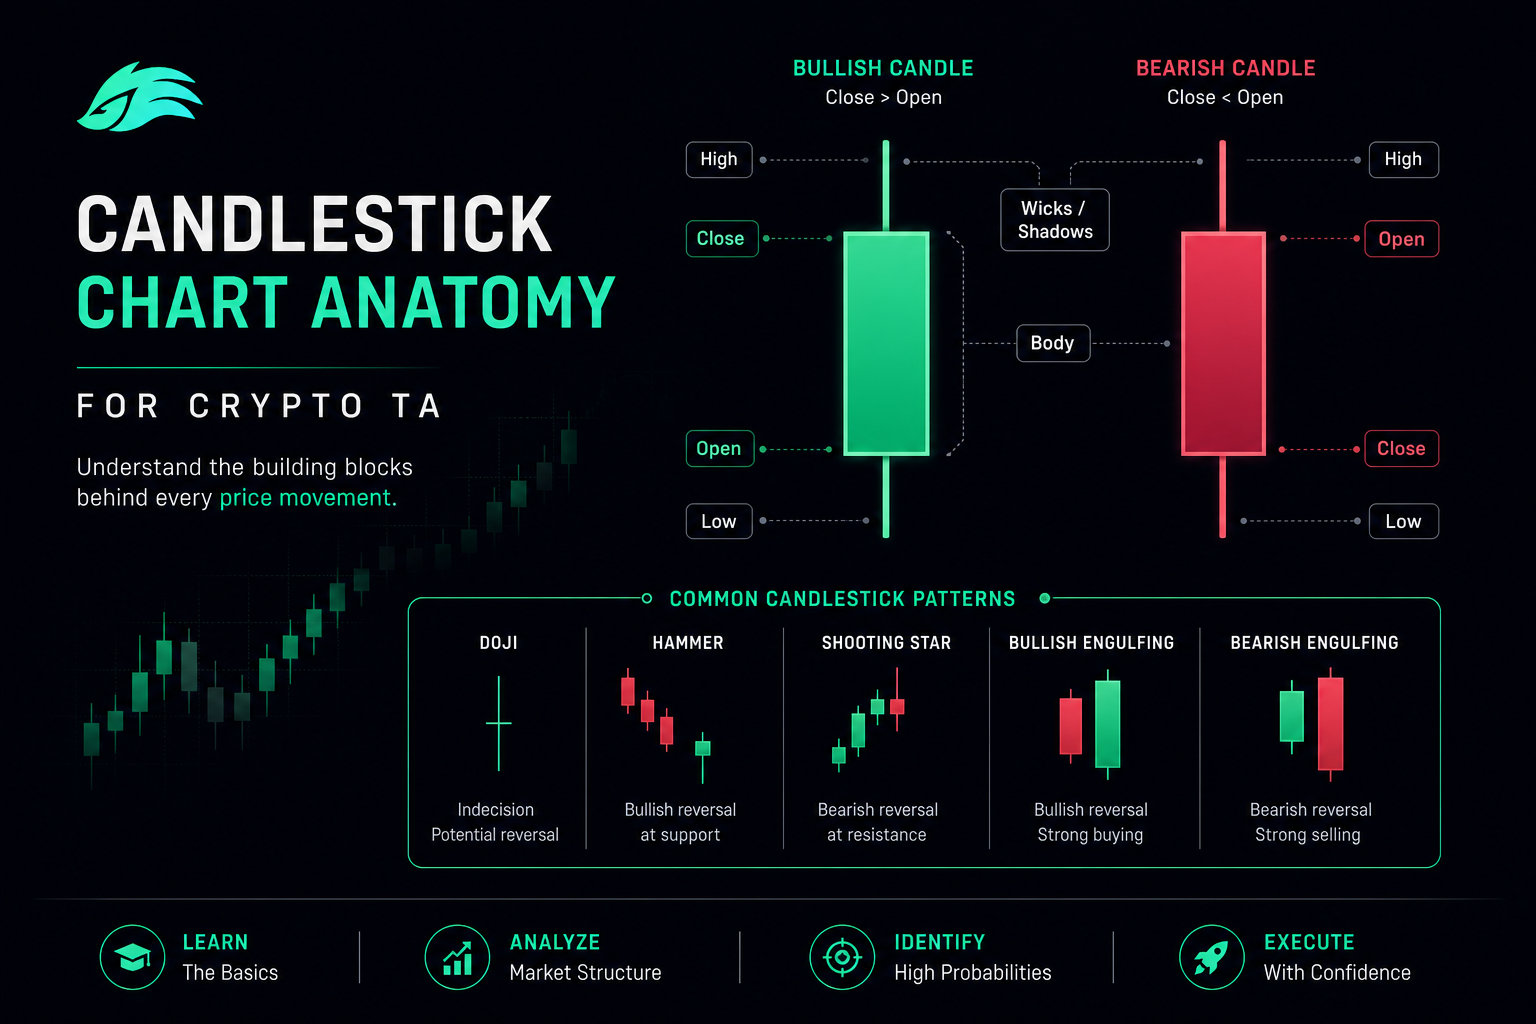
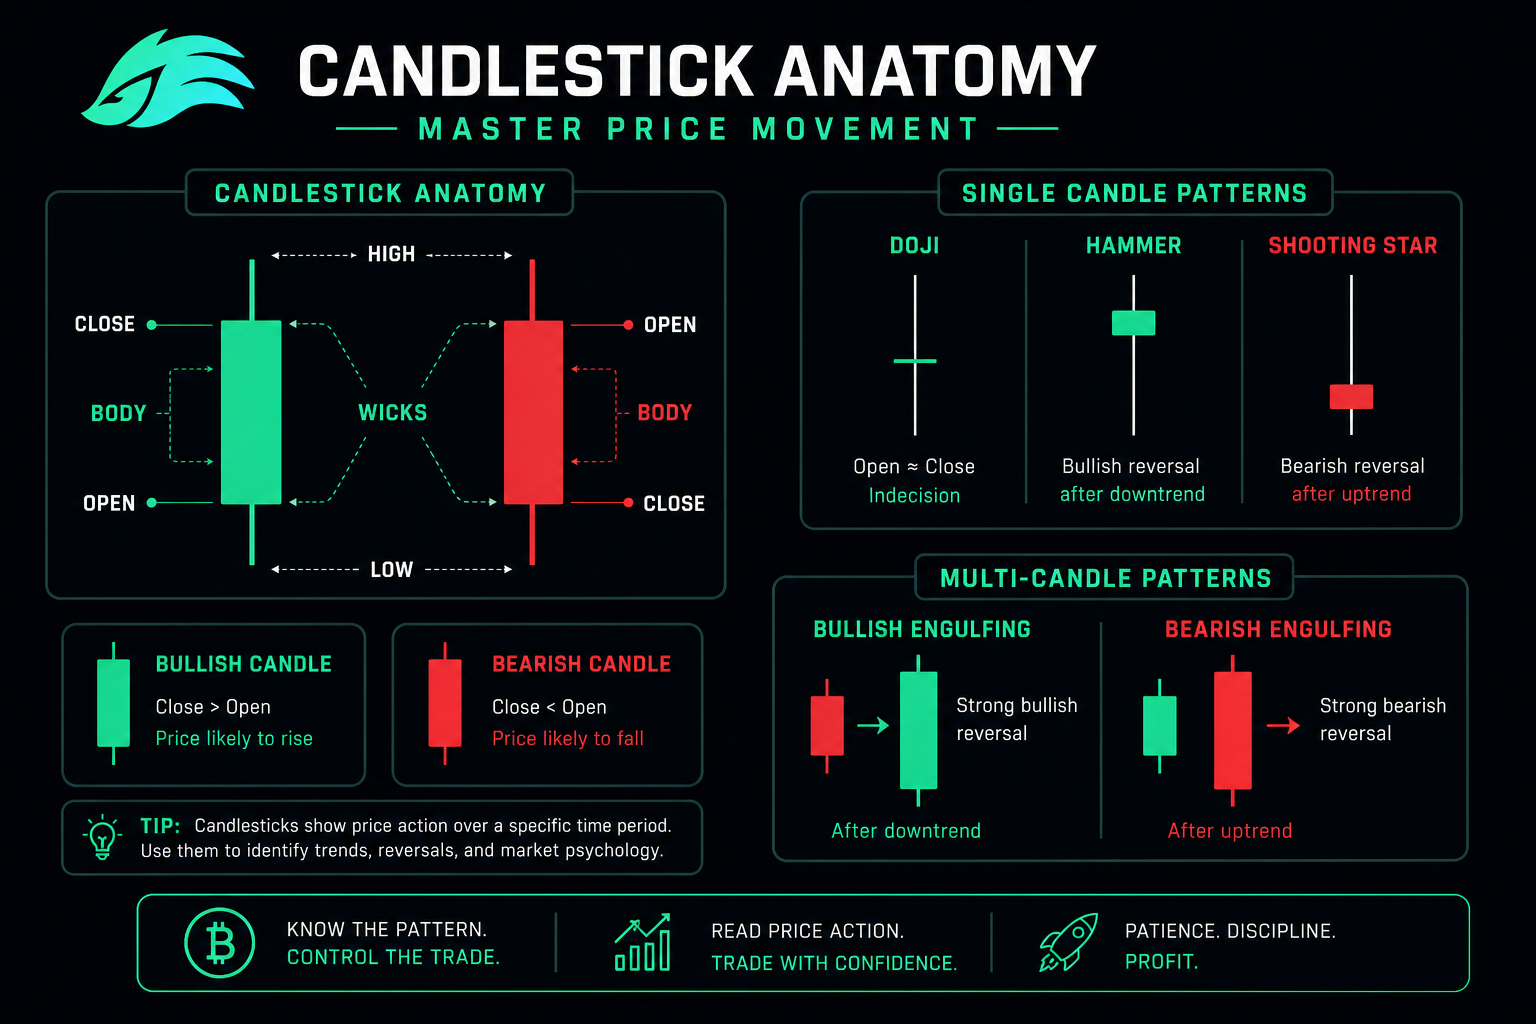
Each candlestick shows four prices for a specific time period (1 minute, 1 hour, 1 day, etc.):
- Open: Price at the start of the period
- Close: Price at the end
- High: Highest price reached
- Low: Lowest price reached
The "body" is the rectangle between open and close. The "wicks" (or "shadows") are the lines extending to high and low.
Green (or white) candle: Close higher than open (price went up during the period) Red (or black) candle: Close lower than open (price went down)
Common Single-Candle Patterns
Doji: Open ≈ close. Indicates indecision. Often signals trend reversal at extremes.
Hammer: Small body at top, long lower wick. Strong rejection of lower prices. Bullish signal after downtrends.
Shooting Star: Small body at bottom, long upper wick. Strong rejection of higher prices. Bearish signal after uptrends.
Marubozu: Large body, minimal wicks. Strong directional conviction in the candle's color.
Common Multi-Candle Patterns
Engulfing patterns: A candle that completely engulfs the previous one in the opposite direction. Strong reversal signal.
Morning Star / Evening Star: Three-candle reversal patterns. Morning star (bullish) at bottoms; evening star (bearish) at tops.
Three Soldiers / Three Crows: Three consecutive same-direction candles indicating strong trend continuation.
The practical takeaway: Don't memorize 50+ patterns. Focus on 8-10 reliable ones: doji, hammer, shooting star, bullish/bearish engulfing, and morning/evening stars. These cover most trading scenarios.
Support and Resistance: The Most Important Concept
Support and resistance are the bedrock of technical analysis — and the single most important concept for new traders.
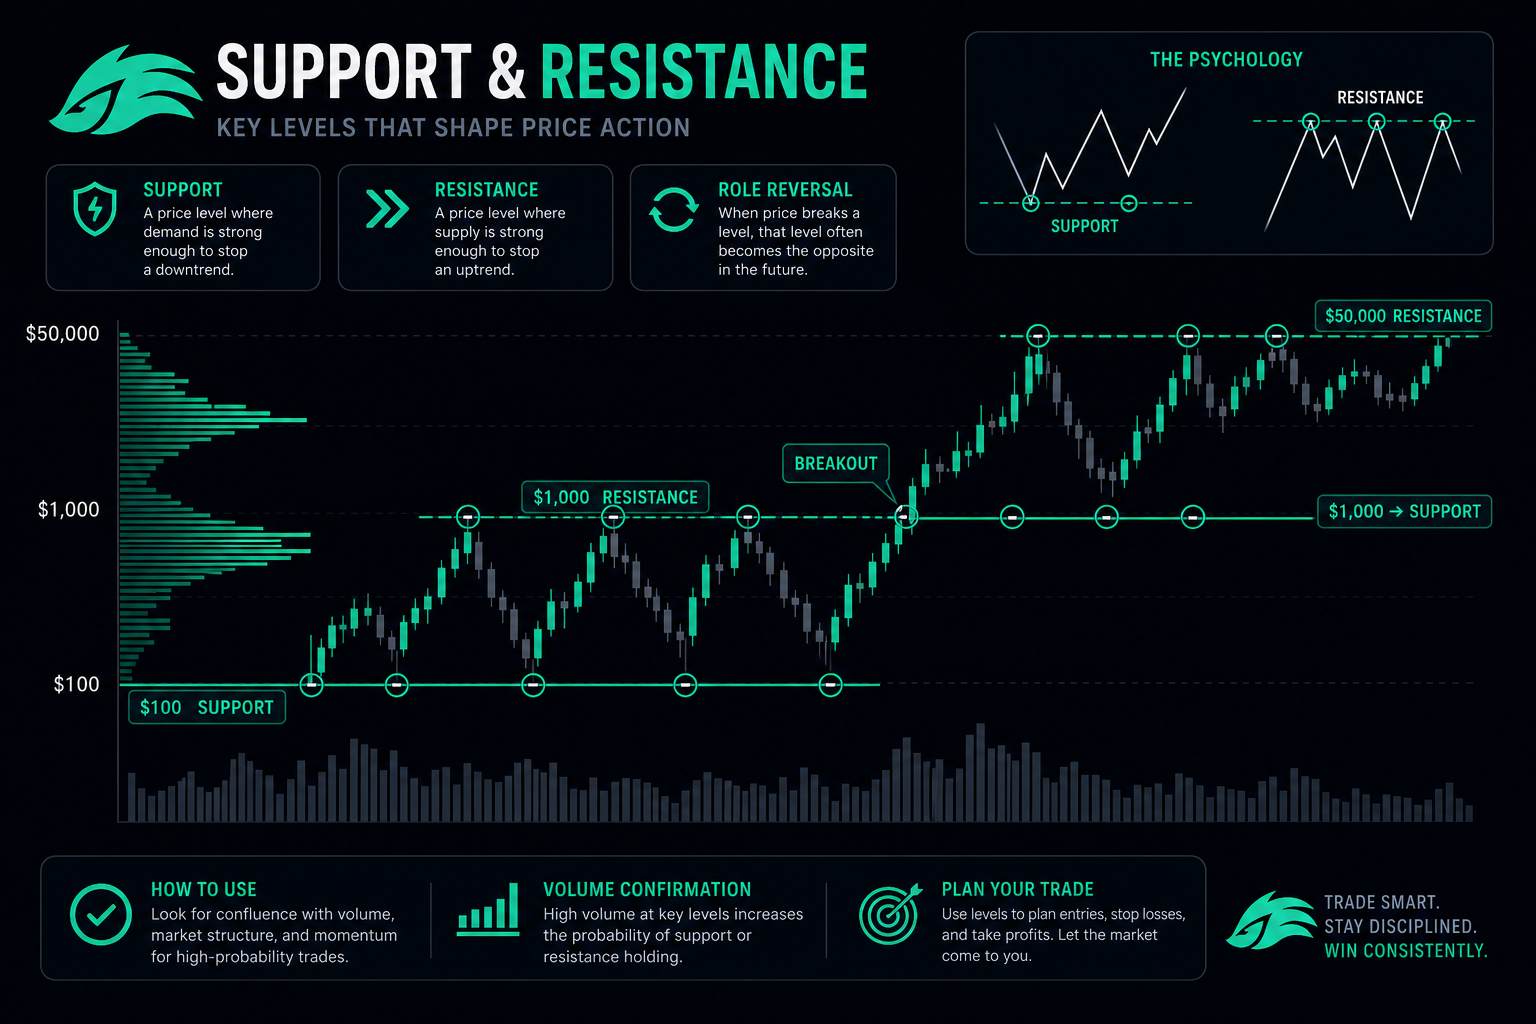
Support: A price level where buying pressure has historically been strong enough to halt or reverse price drops. Think of it as a "floor."
Resistance: A price level where selling pressure has historically been strong enough to halt or reverse price rises. Think of it as a "ceiling."
Why these levels matter: Market participants remember important price levels. Past lows often act as support; past highs often act as resistance. Traders place orders around these levels, creating self-fulfilling price action.
How to identify them:
1. Horizontal levels: Draw lines at obvious previous highs, lows, and consolidation areas. The more times a level has been tested, the more significant it becomes.
2. Round numbers: Major round prices ($100, $1,000, $50,000) often act as psychological support/resistance because traders cluster orders around them.
3. Previous all-time highs/lows: These often become major levels.
4. Volume profile: Areas with heavy historical trading volume often act as future support/resistance.
The key principle: support becomes resistance, and vice versa. When price breaks below previous support, that level often becomes resistance on retests. This "polarity" is one of the most reliable TA concepts.
Practical use: Most traders enter near support (with stop loss below) for long trades, or near resistance (with stop loss above) for shorts. Risk-reward calculations rest on these levels.
Identifying Trends
Trends are the second foundational concept. A trader who correctly identifies the trend and trades with it has a major edge.
Three Trend Types
Uptrend: Higher highs and higher lows. Each peak is higher than the previous; each correction bottoms higher than the previous. Buy dips; resist shorting.
Downtrend: Lower highs and lower lows. Each rally peaks lower than previous; each drop bottoms lower than previous. Sell rallies; resist buying dips.
Sideways/Range: No clear higher highs or lower lows. Price oscillates between defined support and resistance. Trade the range until clear breakout.
Trend Strength Indicators
Moving Averages (MAs): The most popular trend indicator. A simple moving average (SMA) calculates average price over X periods. Common MAs: 20, 50, 100, 200-day.
- Price above 200-day MA: Long-term uptrend
- Price below 200-day MA: Long-term downtrend
- 20-day MA above 50-day MA: Short-term uptrend
- "Golden cross" (50-day crosses above 200-day): Major bullish signal
- "Death cross" (50-day crosses below 200-day): Major bearish signal
ADX (Average Directional Index): Measures trend strength (not direction). ADX above 25 = strong trend; below 20 = weak/ranging market.
Trendlines: Draw lines connecting consecutive higher lows (uptrend) or lower highs (downtrend). Breaks of significant trendlines often signal trend changes.
The practical rule: Don't fight the trend. Trade with it. Counter-trend trading has lower win rates and requires more skill than trend-following.
Essential Technical Indicators
Indicators are mathematical calculations applied to price/volume data. They produce signals visible on charts. The best traders use 3-5 reliable indicators — not 15.
RSI (Relative Strength Index)
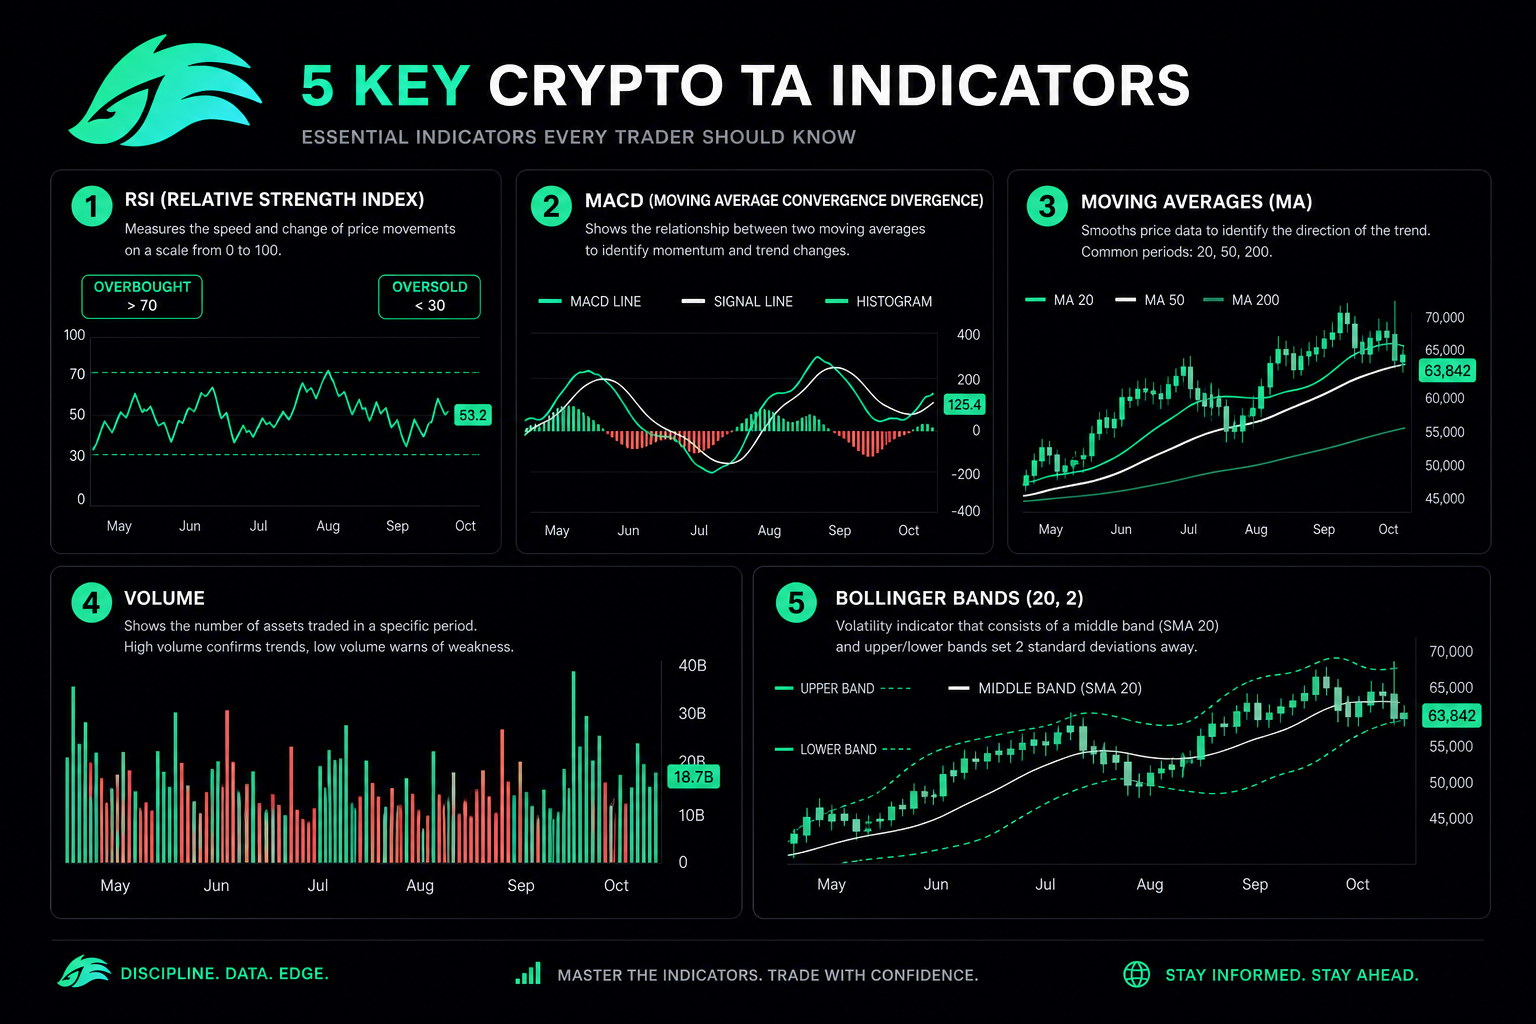
What it does: Measures momentum on a scale of 0-100. Above 70 = potentially overbought (price may pull back); below 30 = potentially oversold (price may bounce).
How to use:
- Overbought/oversold extremes for potential reversal signals
- Divergences (price makes new high but RSI doesn't) for trend exhaustion
- Avoid as standalone signal in strong trends — RSI can stay overbought/oversold for extended periods
MACD (Moving Average Convergence Divergence)
What it does: Compares two moving averages (typically 12 and 26 periods) to measure momentum and trend changes.
How to use:
- MACD line crossing above signal line = bullish momentum
- MACD line crossing below signal line = bearish momentum
- Histogram height shows momentum strength
- Divergences signal weakening trends
Moving Averages (MA)
What it does: Smooths price action by averaging over X periods. The most fundamental indicator.
How to use:
- Determine trend direction (price vs MA)
- Dynamic support/resistance (price often respects key MAs)
- Crossovers signal trend changes
- Standard MAs: 9, 20, 50, 100, 200
Volume
What it does: Shows how much asset traded in each period. Not technically an indicator, but critical context.
How to use:
- Confirming moves: breakouts with high volume are more reliable
- Climax volume: unusually high volume at extremes often signals reversals
- Volume drying up during consolidation often precedes breakouts
- Volume divergence (price makes new high on low volume) signals weakness
Bollinger Bands
What it does: A moving average with bands at standard deviations above and below. Measures volatility.
How to use:
- Price touching upper band = potentially overbought in range
- Price touching lower band = potentially oversold in range
- Band squeeze (bands narrowing) often precedes major moves
- Don't use in strong trends — price can ride the upper or lower band
The honest principle: Pick 3-5 indicators that you genuinely understand and stick to them. Most failed traders have charts with 10+ indicators producing conflicting signals. Simplicity wins.
Chart Patterns Every Trader Should Know
Chart patterns are recurring price formations that signal likely future moves.
Reversal Patterns
Head and Shoulders: Three peaks, with the middle higher than the others. Bearish reversal pattern at tops. Mirror image (inverse head and shoulders) is bullish reversal at bottoms.
Double Top / Double Bottom: Price hits a level twice without breaking through. Signals reversal. Confirmed by breaking the "neckline" between the two peaks/troughs.
Triple Top / Bottom: Same as double but with three tests. Even stronger signal.
Continuation Patterns
Flags / Pennants: Brief consolidation after a strong move. Continuation typically resumes in the original direction.
Triangles: Ascending (rising lows, flat highs — usually bullish breakout), descending (falling highs, flat lows — usually bearish breakout), symmetrical (converging — direction unclear until breakout).
Cup and Handle: Cup-shaped consolidation followed by smaller pullback ("handle") then breakout. Generally bullish.
Practical Pattern Trading
1. Wait for confirmation. A pattern isn't valid until the breakout occurs WITH volume.
2. Define your invalidation point. What price would prove the pattern wrong? That's your stop loss.
3. Calculate measured moves. Many patterns suggest specific price targets (e.g., head-and-shoulders height projected from neckline break).
4. Don't see patterns where they don't exist. "Pareidolia" is real — humans see patterns in random noise. Be skeptical of fuzzy patterns.
Multi-Timeframe Analysis
The technique that separates intermediate from advanced traders.
The core idea: Confirm setups across multiple timeframes. A trade idea visible on the 1-hour chart should align with the trend on the 4-hour and daily charts.
Standard timeframe stacks:
Day trader stack: 1m / 5m / 15m / 1h / 4h
- Use 4h for trend direction
- Use 1h for setup identification
- Use 15m for entry timing
- Use 5m/1m for execution
Swing trader stack: 1h / 4h / Daily / Weekly
- Use Weekly for major trend
- Use Daily for setup
- Use 4h for entry
- Use 1h for execution
Position trader stack: Daily / Weekly / Monthly
- Use Monthly for major trend
- Use Weekly for setup
- Use Daily for entry
The rule: Always trade in the direction of the higher timeframe trend. Higher timeframes have more weight than lower ones. A weekly downtrend overrides a 1-hour bullish setup more often than not.
This isn't optional — it's the single most impactful improvement most traders can make to their win rates.
Common TA Mistakes Beginners Make
For balance, the patterns that destroy beginner TA traders:
1. Indicator overload. 10+ indicators creating conflicting signals. Pick 3-5 and master them.
2. Trading every setup you see. Selectivity is profitable. The best traders trade 1-3 high-quality setups per day, not 20 mediocre ones.
3. Ignoring the broader trend. Counter-trend trading has much lower win rates. When in doubt, trade with the higher timeframe trend.
4. Moving stop losses against you. Once a stop is set, don't move it further away when price moves against you. That's how big losses happen.
5. Confirmation bias. Looking for evidence that supports the trade you want to make rather than evaluating objectively.
6. Failing to journal trades. You can't improve what you don't measure. Every trade should be documented: setup, entry, exit, outcome, lessons.
7. Chasing breakouts. Buying after a clear breakout is often buying the top. Many breakouts fail. Better entries usually come on retests.
8. Mistaking randomness for signal. Short-term price action is noisy. Higher timeframes filter out noise.
9. Skipping the basics. Trying to use complex strategies before mastering candlesticks, support/resistance, and trend identification.
How to Practice Technical Analysis
For traders developing TA skills:
Step 1: Pick 2-3 assets to focus on. Bitcoin, Ethereum, and Solana (or top 5) are ideal. Liquid, deep markets with clean patterns.
Step 2: Master one timeframe first. Daily charts are best for beginners — less noise, fewer decisions, more reliable patterns.
Step 3: Backtest manually. Open old charts. Mark where you would have entered, exited, and your stop loss. Track results. This builds pattern recognition faster than live trading.
Step 4: Paper trade. Practice on demo accounts before risking capital. Most major platforms offer this.
Step 5: Trade tiny. Start with positions so small that losses are emotionally meaningless. Scale up only with proven consistency.
Step 6: Journal every trade. Setup chart, entry reasoning, plan, actual exit, lessons. Review weekly.
Step 7: Be patient. Real TA skill takes 6-24 months of focused practice. There are no shortcuts.
Practice TA on integrated Solana terminal — GraphDex
Apply TA with Bubble Maps & charts on GraphDex
How GraphDex Supports TA-Driven Trading
GraphDex consolidates TA-relevant tools for active Solana traders:
- Multi-timeframe charts integrated with execution
- Bubble Maps showing holder distribution and concentration — fundamental data combined with TA
- Pulse feed surfacing new tokens with momentum signals
- AI signals identifying setups that match TA patterns
- MEV protection preventing sandwich attacks during trade execution
- Wallet/social tracking to follow successful traders' moves
- Fee-based 17% APY staking on stablecoins between trades (no idle capital)
- Non-custodial Privy wallet — sign in with Twitter, email, or Telegram
The integrated approach means your charts, analysis, execution, and yield all happen in one place — reducing the context-switching overhead that kills active trader productivity.
Frequently Asked Questions
What is technical analysis in crypto? Technical analysis (TA) is the study of price charts and volume to forecast probable future price movements. It rests on three assumptions: market action discounts everything, prices move in trends, and history repeats itself. TA provides probabilistic edges (55-65% win rates for skilled traders) — not certainties.
Does technical analysis actually work? Yes, but with caveats. TA provides probabilistic edges, not guarantees. Studies and practical experience show that skilled TA practitioners can achieve consistent 55-65% win rates with proper risk management. However, most retail traders fail — usually because of poor risk management or emotional decisions, not because TA doesn't work.
What's the best indicator for crypto trading? There's no single best indicator. The most universally useful combination for beginners is: moving averages (trend), RSI (momentum/overbought conditions), and volume (confirmation). Master these three before adding more. The biggest mistake new traders make is using too many indicators.
How long does it take to learn TA? Basics (candlesticks, support/resistance, trend) can be learned in weeks. True proficiency — where TA actually drives consistent profits — typically takes 6-24 months of focused practice. Becoming an expert takes years. There are no shortcuts.
Can I use TA for memecoins? Yes, but with major caveats. TA works less reliably on small-cap memecoins because: (1) low liquidity creates erratic patterns, (2) coordinated buying/selling can override TA signals, (3) many memecoins are pump-and-dump schemes. Combine TA with on-chain analysis (Bubble Maps holder distribution) for memecoin trades.
What timeframe should I use? Match timeframe to your style: scalpers use 1-15 minute charts, day traders 5min-4 hour, swing traders 4 hour-daily, position traders daily-weekly. Beginners should start with daily charts — less noise, more reliable patterns. Always confirm setups across multiple timeframes.
Is TA enough to be profitable, or do I need fundamentals too? TA alone can be profitable with proper risk management. Many successful crypto traders use TA exclusively. However, combining TA with awareness of fundamentals (especially for altcoins: tokenomics, team, use case) improves selection. For Bitcoin/Ethereum/Solana, TA is typically sufficient; for smaller altcoins, fundamental awareness reduces blow-up risk.
About This Guide
This guide is published by the GraphDex Research team — analysts and traders building the infrastructure for digital asset trading on Solana. Our content is based on direct trading experience, current market data, and widely accepted technical analysis principles.
Sources & data: Indicator details and pattern descriptions reflect standard technical analysis as practiced in 2026. TA provides probabilistic edges, not guarantees — all trading carries risk of loss. This guide is educational and not financial advice.
GraphDex is the infrastructure for digital asset trading — trade, predict, and earn in one place. Learn more at graphdex.io.
Last reviewed: May 2026 · GraphDex Research
The infrastructure for digital asset trading. Trade, predict, stake, repeat. graphdex.io