By GraphDex Research · Reviewed for accuracy May 2026
Quick Answer
The most useful crypto trading indicators are simpler than most traders think — master 3-5 of these before adding more:
- Moving Averages (MA): Trend direction and dynamic support/resistance
- RSI (Relative Strength Index): Momentum and overbought/oversold conditions
- MACD (Moving Average Convergence Divergence): Trend changes and momentum
- Volume: Confirmation of price moves and reversal signals
- Bollinger Bands: Volatility and mean reversion
- Fibonacci Retracements: Pullback targets in trends
- VWAP (Volume-Weighted Average Price): Institutional reference price
The honest rule: 3-5 well-understood indicators beat 15 indicators producing conflicting signals. Indicators confirm hypotheses — they don't replace price action analysis.
Trade Solana with integrated indicators on GraphDex
Key Takeaways
- The best indicators are simpler than beginners assume — MA, RSI, MACD, and volume cover 80% of cases.
- Indicators are confirmation tools — they don't predict by themselves.
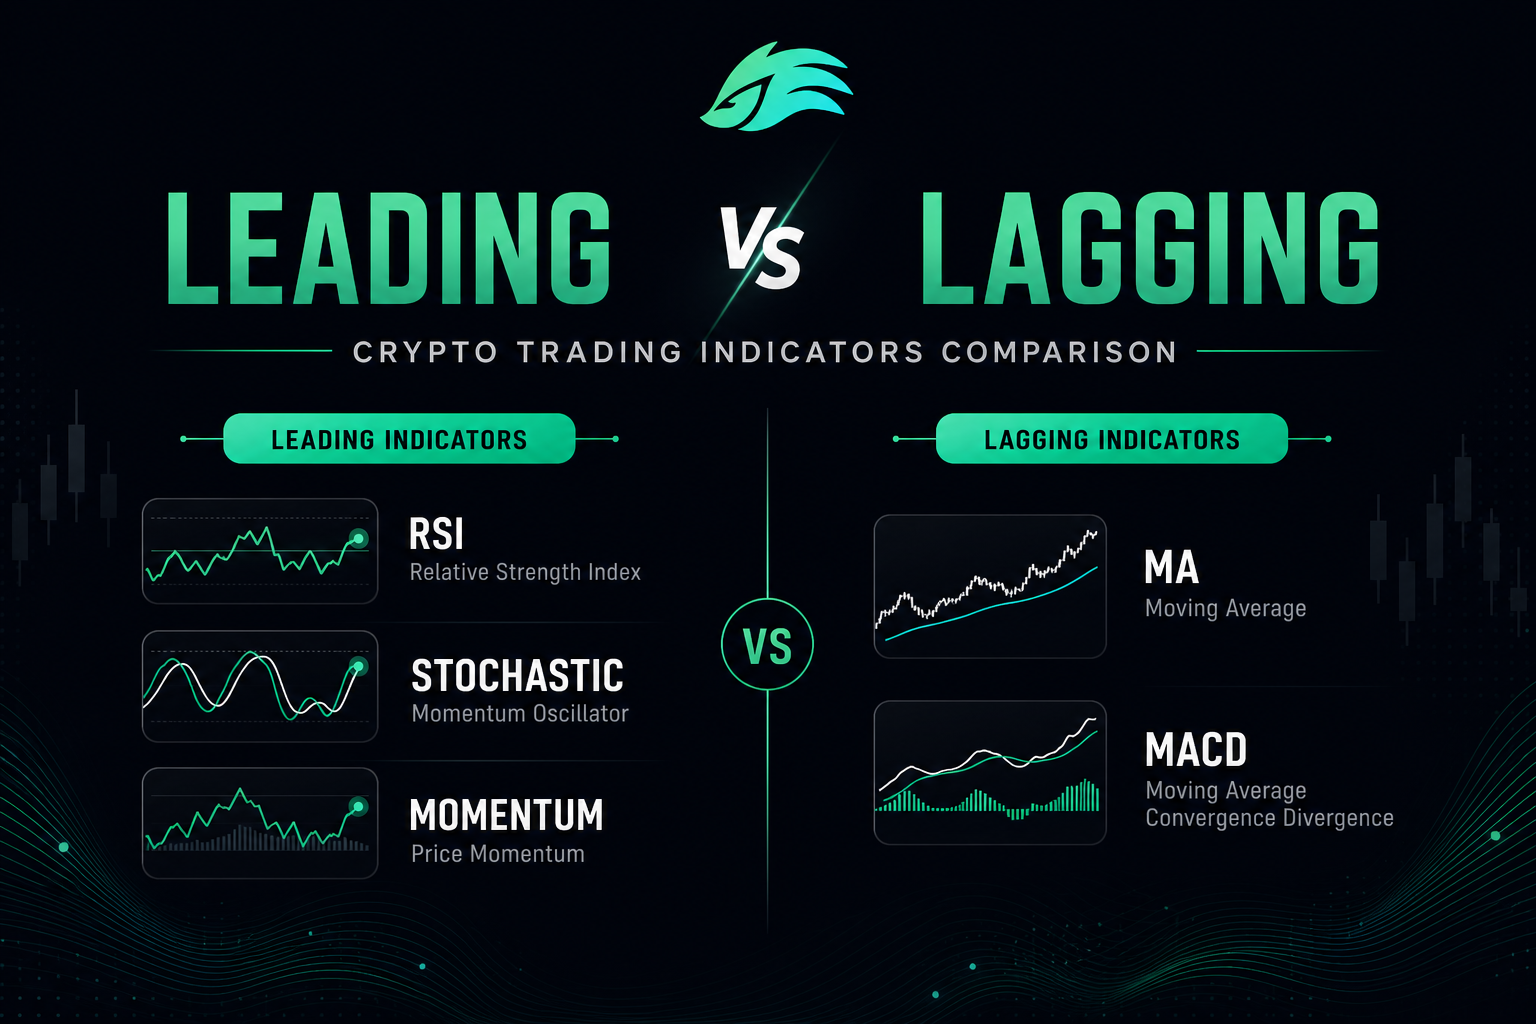
- Lagging indicators (MA, MACD) show trends; leading indicators (RSI, momentum) show extremes.
- Combine 1 trend indicator + 1 momentum indicator + volume for a robust core setup.
Why Use Indicators?
Technical indicators are mathematical calculations applied to price and/or volume data. They produce visual signals (lines, histograms, dots) that help traders identify conditions invisible from raw price action alone.
What indicators do well:
- Quantify subjective concepts (trend, momentum, volatility)
- Provide objective signals for entry/exit decisions
- Confirm or contradict price action hypotheses
- Identify divergences (price doing one thing while momentum does another)
- Standardize analysis across different markets and timeframes
What indicators don't do:
- Predict the future (they're calculations on past data)
- Replace price action understanding
- Work in all market conditions equally
- Generate profits without proper risk management
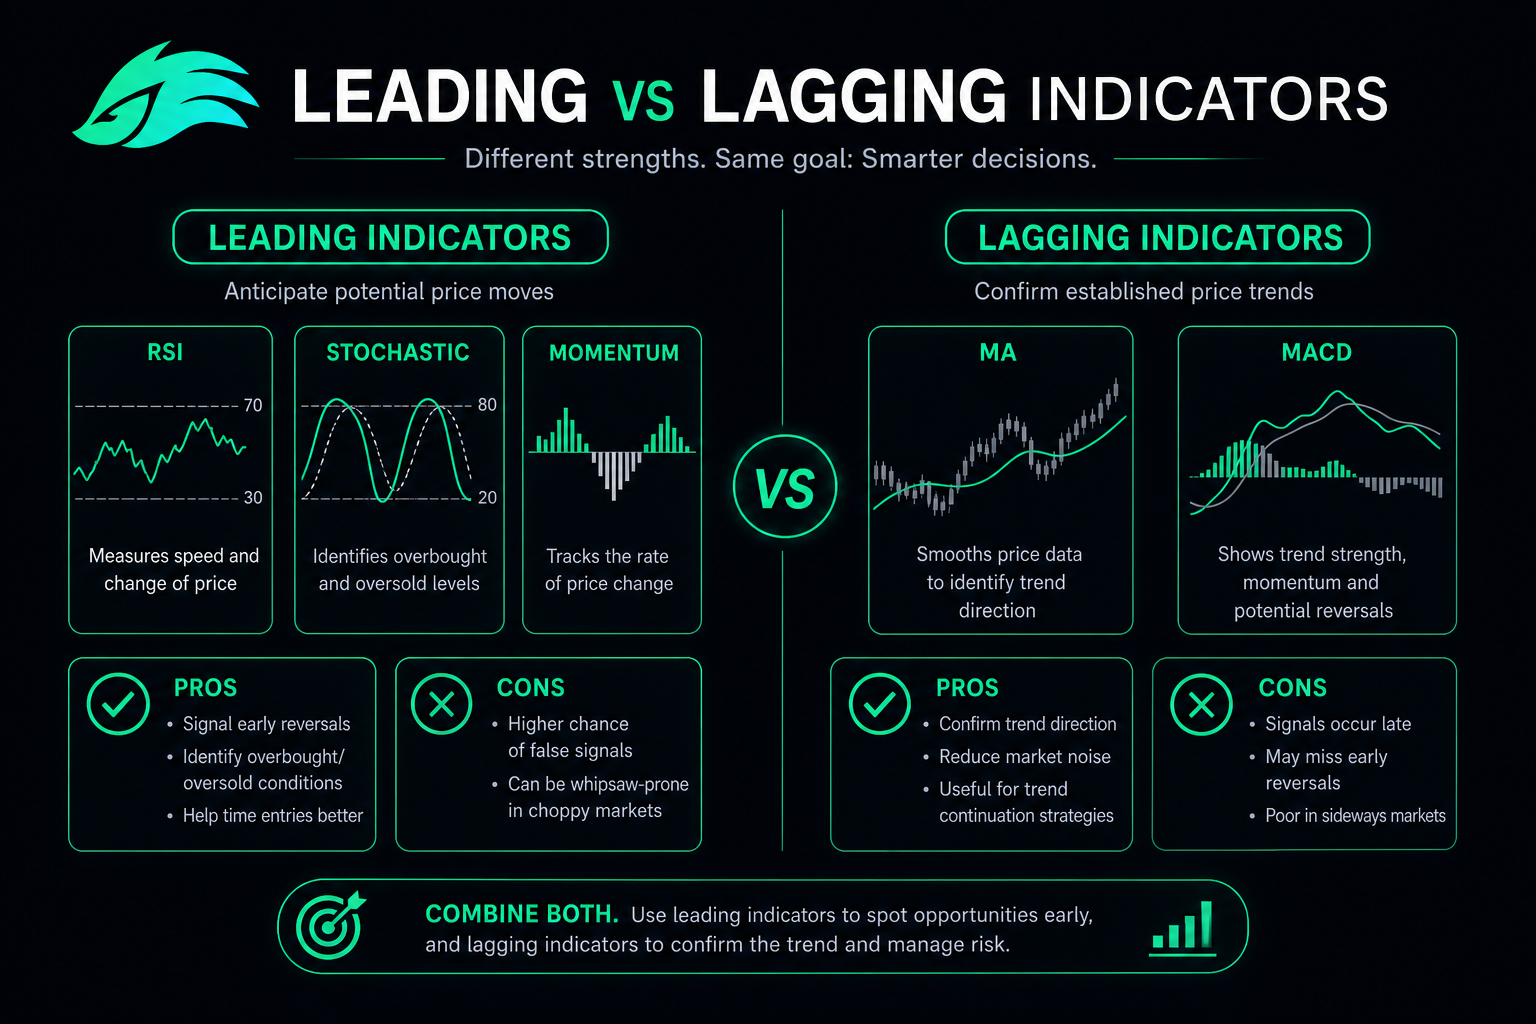
Leading vs. lagging indicators:
Lagging indicators (Moving Averages, MACD) confirm trends after they're established. Less false signals, but later entries. Good for trend-following.
Leading indicators (RSI, Stochastic, Momentum) attempt to predict turning points before they happen. Earlier signals, but more false signals. Good for range-bound or mean-reversion strategies.
The practical rule: Combine both. Use lagging indicators to confirm trend direction; use leading indicators to time entries within that trend.
Moving Averages: The Foundation
Moving averages are the single most important indicator family. Every serious trader uses them in some form.
What Moving Averages Do
A moving average smooths price action by averaging the closing prices over a defined number of periods. The result is a line that filters out short-term noise and reveals underlying trend.
Simple Moving Average (SMA) vs Exponential Moving Average (EMA)
SMA: Simple arithmetic average of closing prices. Equal weight to all data points. Smoother but slower to react.
EMA: Gives more weight to recent prices. Faster to react to current price action. Preferred by most active traders.
For most traders, EMAs are slightly better for trend identification due to faster reactivity.
The Key Moving Averages
- 9-period MA: Short-term momentum
- 20-period MA: Short-term trend (~ 1 month on daily chart)
- 50-period MA: Medium-term trend (~ 2.5 months on daily)
- 100-period MA: Long-term trend
- 200-period MA: Major long-term trend — the most-watched MA globally
How to Use Moving Averages
1. Trend direction: Price above MA = uptrend; price below MA = downtrend. Simplest and most reliable use.
2. Dynamic support/resistance: Price often "bounces" off key MAs (especially 50, 100, 200). Common entry points.
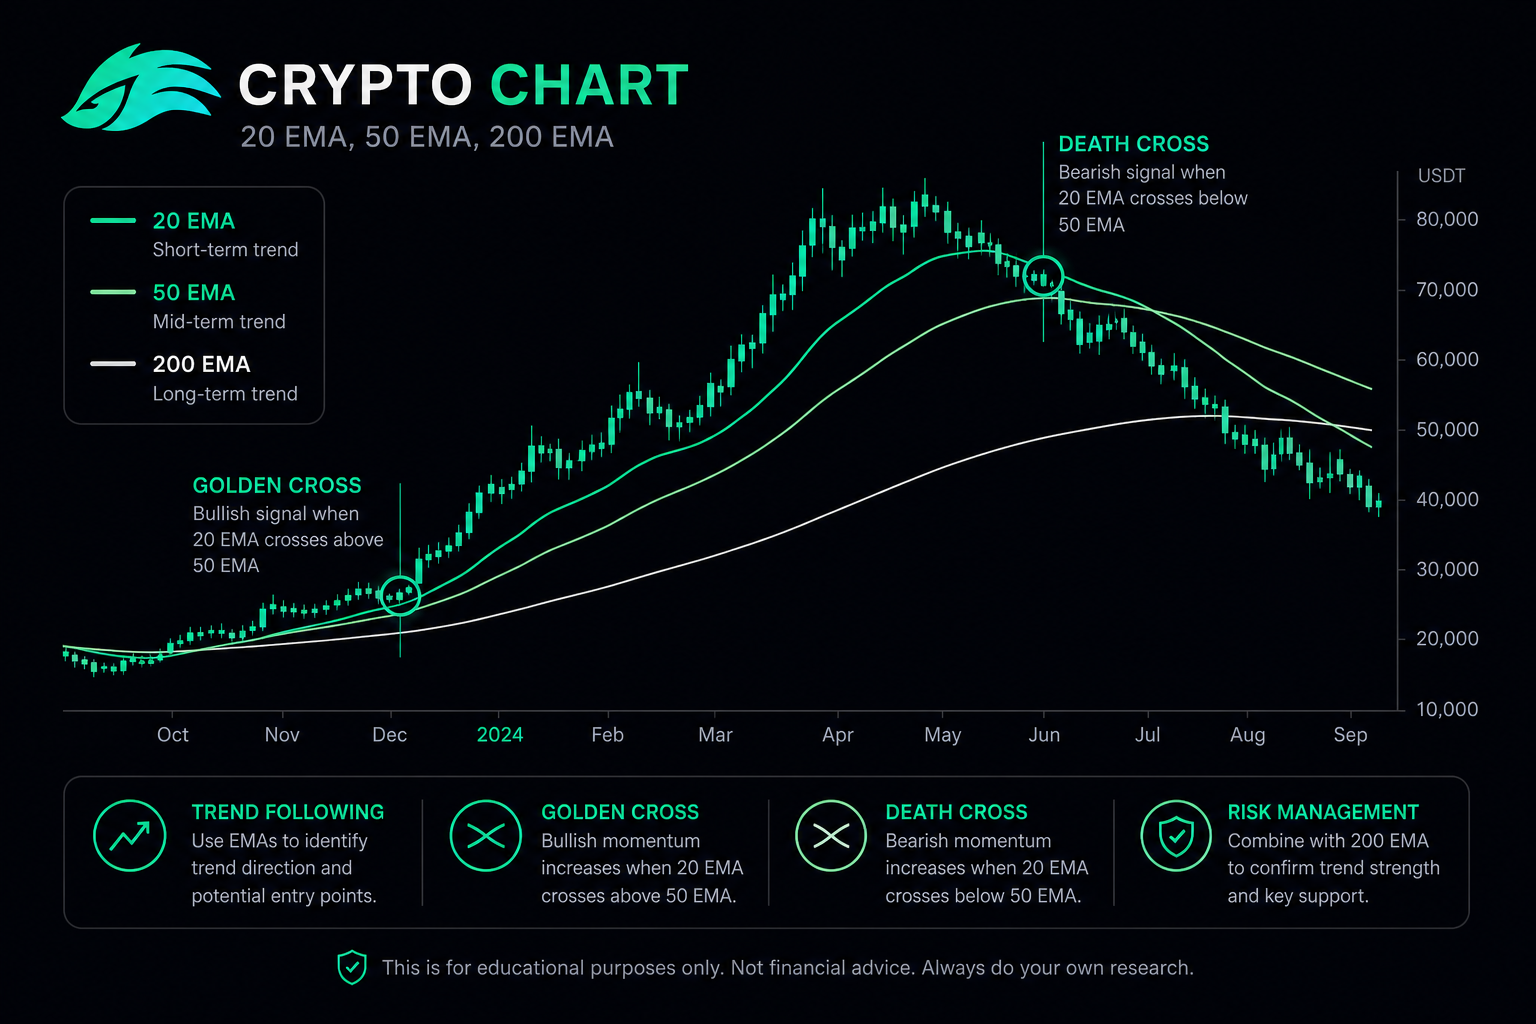
3. Crossovers: When a shorter MA crosses above a longer MA, it's bullish (e.g., "golden cross" = 50 crossing above 200). Vice versa is bearish ("death cross").
4. MA slope: Rising MA = strengthening uptrend; flat MA = consolidation; falling MA = downtrend.
5. MA stack: If short MAs > medium MAs > long MAs, you have a clean uptrend. Reversed for downtrend.
Common setup: Use the 20 EMA for short-term trend, the 50 EMA for medium-term confirmation, and the 200 EMA for major trend context. This three-MA stack covers most timeframes.
RSI: Momentum and Extremes
The Relative Strength Index measures the speed and magnitude of price changes. Developed by J. Welles Wilder in 1978, it remains one of the most popular indicators globally.
What RSI Shows
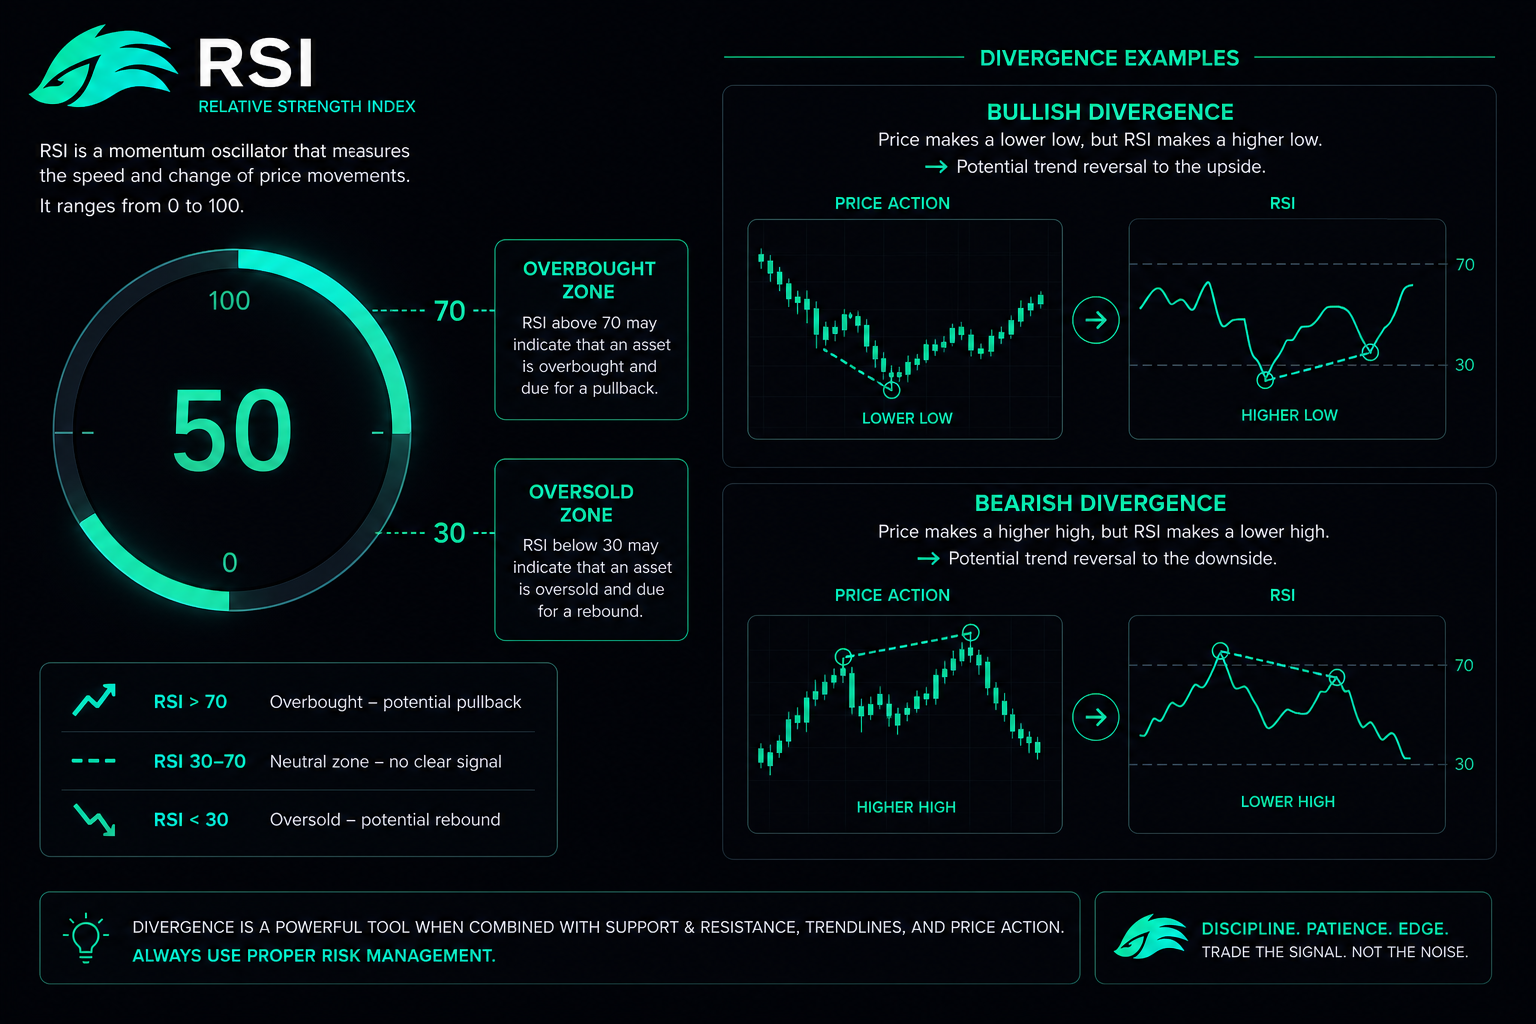
RSI oscillates between 0 and 100, calculated over a standard 14-period lookback:
- Above 70: Potentially overbought — momentum may be unsustainable
- Below 30: Potentially oversold — selling may be exhausting
- 50 line: Neutral momentum
- Above 50: Bullish bias
- Below 50: Bearish bias
How to Use RSI
1. Overbought/oversold signals: In ranging markets, RSI > 70 suggests potential sell setup; RSI < 30 suggests potential buy. Use only in ranges — in strong trends, RSI can stay overbought or oversold for extended periods.
2. Bullish divergence: Price makes lower lows but RSI makes higher lows. Signals weakening downtrend and potential reversal.
3. Bearish divergence: Price makes higher highs but RSI makes lower highs. Signals weakening uptrend and potential reversal.
4. Centerline crossovers: RSI crossing above 50 = bullish; below 50 = bearish. Trend continuation signal.
5. Failure swings: When RSI fails to make a new high (during uptrend) or new low (during downtrend), trend exhaustion is suggested.
Common RSI Mistakes
1. Using RSI signals in trending markets. "Overbought" can stay overbought for weeks in strong trends.
2. Trading every divergence. Many divergences fail. Divergences work better at extremes after extended moves than in the middle of moves.
3. Using RSI without price action confirmation. RSI signals alone are weak; combined with candlestick patterns or key levels, they're much stronger.
MACD: Trend Changes and Momentum
The Moving Average Convergence Divergence indicator combines trend-following with momentum. Created by Gerald Appel in the 1970s.
What MACD Shows
MACD consists of three components:
1. MACD Line: Difference between two EMAs (typically 12-period EMA minus 26-period EMA)
2. Signal Line: 9-period EMA of the MACD line
3. Histogram: Visual representation of the difference between MACD and signal lines
How to Use MACD
1. Signal line crossovers: MACD crossing above signal line = bullish momentum shift; MACD crossing below = bearish.
2. Centerline (zero) crossovers: MACD crossing above zero confirms uptrend; below zero confirms downtrend. Slower but more reliable than signal crossovers.
3. Histogram height: Taller histogram = stronger momentum; shrinking histogram = momentum weakening.
4. Divergence: Same as RSI — price making new high but MACD making lower high signals weakening trend.
MACD Strengths and Weaknesses
Strengths: Combines trend and momentum in one indicator. Reduces false signals compared to using MAs alone. Good for trending markets.
Weaknesses: Lagging — signals come after moves are underway. Less useful in choppy/ranging markets. Multiple components can be visually overwhelming for beginners.
Volume: The Often-Forgotten Indicator
Volume isn't technically a calculated indicator, but it's critical context for all other signals.
Why Volume Matters
Volume confirms moves. A breakout on high volume is much more likely to continue than a breakout on thin volume. Volume is the conviction behind price moves.
Volume signals exhaustion. Climactic volume at extremes often marks reversal points. When everyone has bought or sold, there's no one left to drive the move further.
How to Use Volume
1. Breakout confirmation: Breakouts of key levels should have above-average volume. Low-volume breakouts often fail (false breakouts).
2. Volume divergence: Price making new highs on declining volume signals weakening trend. Often precedes reversals.
3. Climactic volume: Unusually high volume at apparent extremes (after extended moves) often signals capitulation/exhaustion.
4. Volume profile: Areas with heavy historical trading volume act as support/resistance. Price tends to react to these zones.
5. Volume-weighted average price (VWAP): Calculation showing the average price weighted by volume. Major reference for institutional traders. Price above VWAP = bullish bias intraday.
The Volume Rule
No volume = no trade. Patterns and breakouts without volume confirmation are weak signals. Major moves should have major volume.
Bollinger Bands: Volatility and Mean Reversion
Created by John Bollinger in the 1980s, this indicator measures volatility around a moving average.
What Bollinger Bands Show
Three lines:
- Middle band: A simple moving average (typically 20-period)
- Upper band: Middle band + 2 standard deviations
- Lower band: Middle band - 2 standard deviations
The bands expand and contract based on price volatility.
How to Use Bollinger Bands
1. Mean reversion in ranges: Price touching the upper band suggests overbought conditions; touching the lower band suggests oversold. Best used in ranging markets.
2. Volatility squeezes: When bands narrow significantly (low volatility), large moves often follow. The "squeeze before the storm."
3. Trend riding: In strong uptrends, price can "ride" the upper band. Don't short just because price is touching upper band in strong uptrends.
4. Band breakouts: Sustained breakouts above the upper band (or below lower) signal expanding volatility — often the start of major trends.
Fibonacci Retracements: Pullback Targets
Based on the mathematical Fibonacci sequence, these retracement levels identify common pullback depths within trends.
Key Fibonacci Levels
- 23.6%: Shallow pullback
- 38.2%: Common pullback in strong trends
- 50%: Not technically Fibonacci, but psychologically important
- 61.8%: The "golden ratio" — most-watched Fibonacci level
- 78.6%: Deep pullback — last opportunity in trend continuation
How to Use Fibonacci
1. Identify the trend. Fibonacci works best in clear trends.
2. Mark swing high and swing low. The major move you're analyzing.
3. Watch reactions at key levels. 38.2%, 50%, and 61.8% are the most-watched.
4. Combine with other signals. Fibonacci alone is weak; Fibonacci + candlestick pattern + support/resistance + volume = high-probability setup.
VWAP: The Institutional Reference
VWAP (Volume-Weighted Average Price) shows the average price weighted by volume over a period — typically the trading day.
Why VWAP Matters
Institutions use VWAP as a benchmark. Major funds aim to buy below VWAP and sell above it. This creates predictable behavior around the indicator.
Day trading reference: Many intraday traders use VWAP as their primary trend reference.
How to Use VWAP
1. Intraday bias: Price above VWAP = bullish intraday; below = bearish.
2. Mean reversion: Extreme deviations from VWAP often correct back toward the line.
3. Trend confirmation: Sustained price action above (or below) VWAP confirms intraday trend direction.
VWAP resets daily and is most useful for intraday trading on 1-15 minute timeframes.
How to Combine Indicators Effectively
The most important skill: combining indicators without creating chaos.
The Core Three Setup (Beginner-Friendly)
1. Moving Averages (Trend): 20 EMA + 50 EMA + 200 EMA
2. RSI (Momentum): 14-period RSI
3. Volume: Volume bars beneath price
This three-tool combination covers trend identification, momentum confirmation, and conviction confirmation. Master this before adding anything.
Advanced Combinations
Trend-following setup: MA stack + MACD + Volume. Strong directional bias.
Mean reversion setup: Bollinger Bands + RSI + Volume. Range-trading focus.
Breakout setup: MA squeeze + Bollinger Band squeeze + Volume expansion + Pattern confirmation.
Rules for Indicator Combinations
1. Don't use redundant indicators. RSI + Stochastic + MFI are all momentum indicators producing similar signals. Pick one.
2. Don't use conflicting indicators. If your indicators consistently disagree, the problem isn't the indicators — it's your selection.
3. One indicator per "category." One trend indicator. One momentum indicator. One volatility indicator. Volume always.
4. Test combinations before using them. Backtest your indicator setup before trading with real money.
5. Less is more. 3-5 indicators beat 10. If your charts look like Christmas trees, you're overcomplicating.
Combine indicators on Solana terminal — GraphDex
Common Indicator Mistakes
For balance, what destroys traders who use indicators:
1. Indicator overload. 10+ indicators showing conflicting signals. Pick 3-5 and master them.
2. Treating indicators as crystal balls. They're calculations on past data, not predictions of the future.
3. Trading indicator signals without price action. RSI hitting 70 means nothing without context. Use indicators to confirm — not replace — price analysis.
4. Using lagging indicators for short-term timing. MAs lag price; don't expect them to call exact tops/bottoms.
5. Ignoring market conditions. Range indicators (RSI, Bollinger) fail in trends; trend indicators (MA, MACD) fail in ranges. Match indicators to conditions.
6. Default settings only. Some indicators benefit from custom periods (RSI 14 isn't always optimal). Test what works for your asset and timeframe.
7. No backtesting. Trading any indicator setup without first verifying it works historically on your specific assets.
Apply indicators on GraphDex Solana terminal
How GraphDex Supports Indicator-Based Trading
For active Solana traders using technical indicators:
- Full TradingView chart integration with all major indicators
- Multi-timeframe analysis across 1m to monthly charts
- Volume integration showing volume bars and indicators
- Bubble Maps combining technical signals with on-chain holder analysis
- Pulse feed with momentum indicators on new tokens
- AI signals confirming high-conviction setups
- MEV protection preventing sandwich attacks on entries/exits
- Fee-based 17% APY staking on stablecoins between trades
- Non-custodial Privy wallet — sign in with Twitter, email, or Telegram
Active Solana traders get professional-grade indicator analysis integrated with execution — no need to juggle TradingView, Bubble Maps, Phantom, and a trading platform separately.
Frequently Asked Questions
What is the best indicator for crypto trading? There's no single best indicator. The most universally useful combination for crypto traders is: Moving Averages (trend direction), RSI (momentum/overbought conditions), and Volume (confirmation). Master this trio before adding more. MACD is excellent as a fourth indicator for momentum confirmation.
Do indicators work in crypto? Yes, often better than in traditional markets. Crypto is dominated by retail traders, social momentum, and 24/7 trading — creating clear patterns and reliable indicator signals. The same principles that drive indicators in stocks apply to crypto, often more cleanly because there's less institutional algorithmic noise.
How many indicators should I use? 3-5 indicators maximum. Use one from each category: trend (MA, MACD), momentum (RSI, Stochastic), volatility (Bollinger Bands, ATR), and volume. Adding more indicators creates conflicting signals rather than clearer analysis. The best traders typically use 3-4 indicators consistently.
What's the difference between RSI and MACD? RSI measures speed and magnitude of price changes on a 0-100 scale — best for identifying overbought/oversold conditions. MACD measures momentum and trend changes through moving average comparisons — best for confirming trend direction and timing entries. They serve different purposes; many traders use both.
Are moving averages a leading or lagging indicator? Lagging. Moving averages calculate from past prices, so they confirm trends after they're established rather than predicting them in advance. This is a feature, not a bug — MAs filter out noise and only signal when trends are real. Trade-off: later entries but fewer false signals.
What is VWAP and why does it matter? VWAP (Volume-Weighted Average Price) shows the average price weighted by volume over a period (typically daily). Institutional traders use it as a benchmark — they aim to buy below VWAP and sell above it. This creates predictable behavior around the indicator. Best used for intraday trading on short timeframes.
Can I trade profitably with just one indicator? Possibly, but it's harder. Single-indicator strategies require excellent risk management and trade selection to overcome their limitations. Most consistently profitable traders combine 2-4 indicators with price action analysis. Single-indicator strategies often fail in changing market conditions that the indicator doesn't capture.
About This Guide
This guide is published by the GraphDex Research team — analysts and traders building the infrastructure for digital asset trading on Solana. Our content is based on direct trading experience, current market data, and widely-accepted technical analysis principles.
Sources & data: Indicator descriptions reflect standard technical analysis as practiced in 2026. Indicators provide probabilistic edges, not guarantees — all trading carries risk of loss. This guide is educational and not financial advice.
GraphDex is the infrastructure for digital asset trading — trade, predict, and earn in one place. Learn more at graphdex.io.
Last reviewed: May 2026 · GraphDex Research
The infrastructure for digital asset trading. Trade, predict, stake, repeat. graphdex.io