By GraphDex Research · Reviewed for accuracy May 2026
Quick Answer
Risk management is the practice of limiting how much capital you lose on any single trade or losing streak. The core principles every trader must follow:
- The 1-2% rule: Never risk more than 1-2% of capital on a single trade
- Position sizing formula: Risk Amount ÷ Stop Distance = Position Size
- Risk-reward minimum 2:1: Potential reward should be at least 2× potential risk
- Daily loss limits: Stop trading at 3-5% account drawdown for the day
- Maximum drawdown rule: If account drops 20-25%, halt trading and reassess
- Position correlation: Avoid 5+ correlated positions (all memecoins, all L1s)
The honest truth: A trader can have a 40% win rate and make money with proper risk management. A trader can have an 80% win rate and lose money without it. Mathematics rules trading.
Trade with risk management on GraphDex Solana terminal
Key Takeaways
- The single biggest predictor of trading success isn't strategy — it's risk management.
- Risk 1-2% maximum per trade; smaller risk per trade means longer survival.
- Position size = Risk amount divided by stop distance (a simple formula every trader should memorize).
- Survive drawdowns of 20-30% with proper sizing; without it, blow-ups happen.
Why Risk Management Matters More Than Strategy
A counterintuitive truth: the math of compounding makes risk management more important than picking better trades.
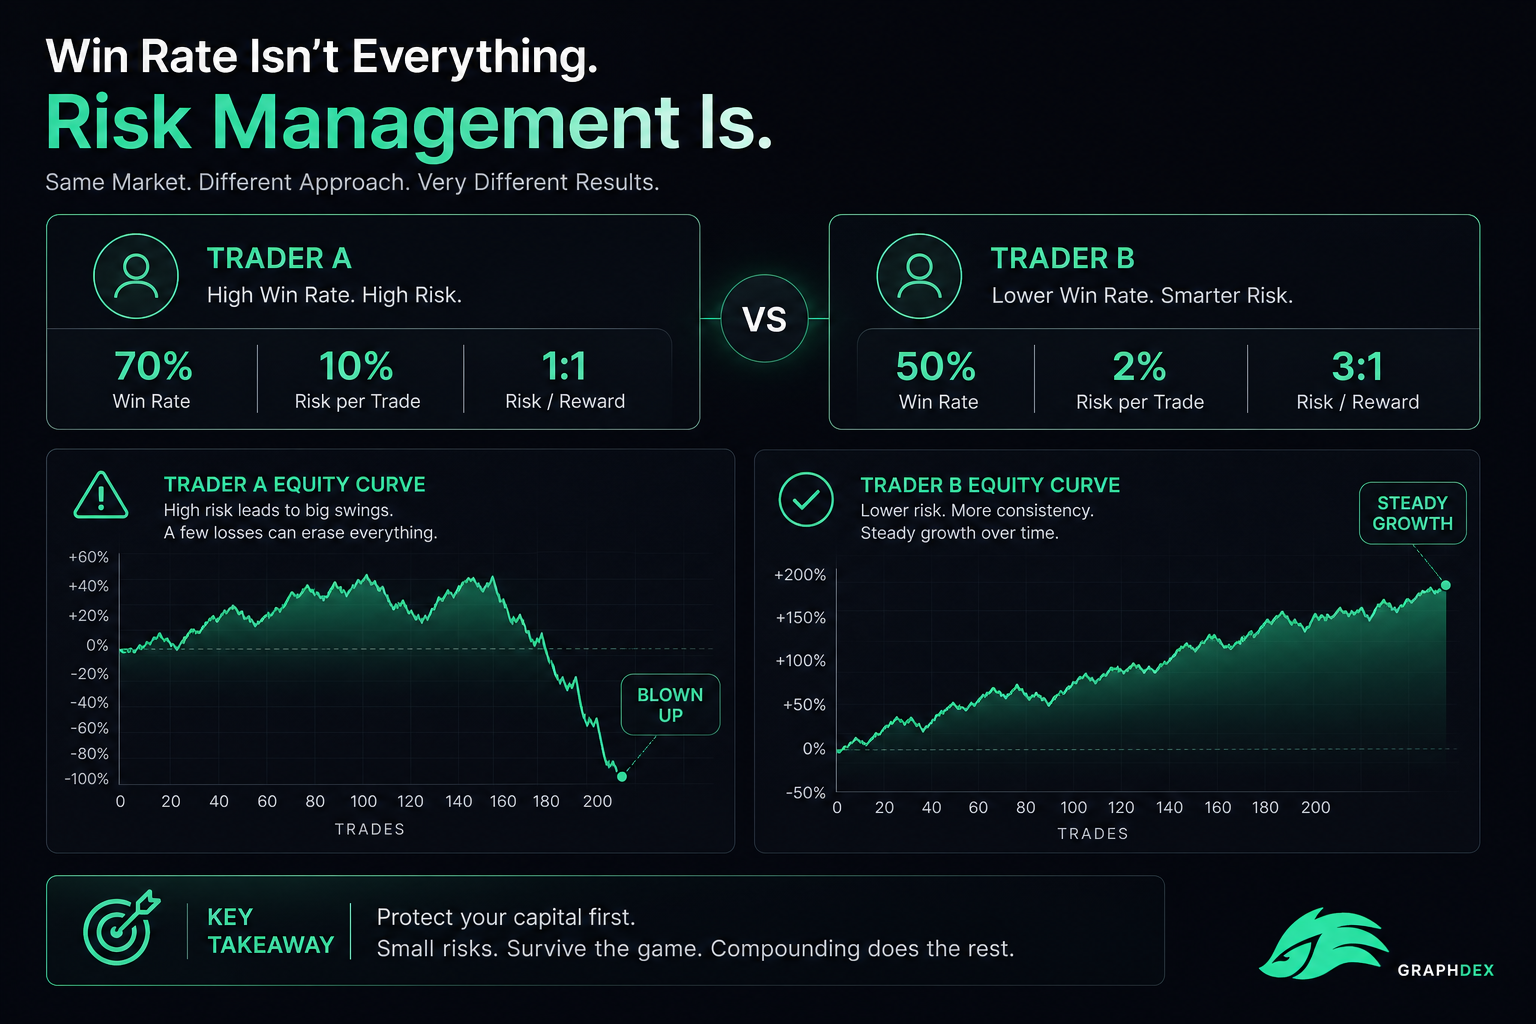
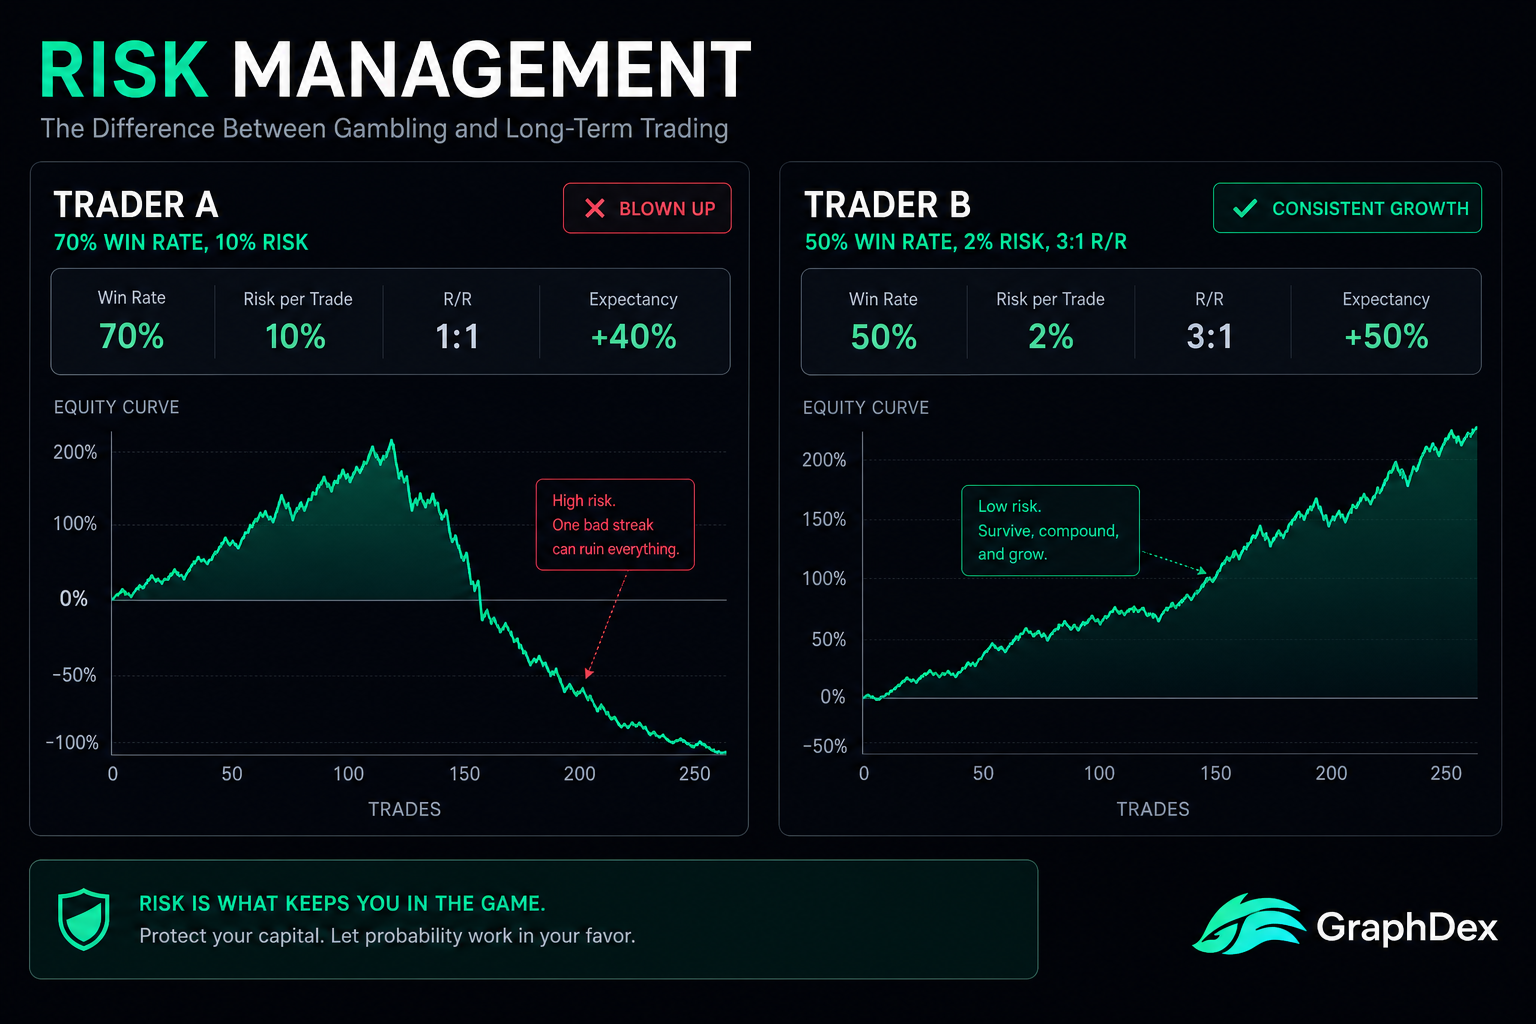
Consider two traders with the same starting capital ($10,000):
Trader A: 70% win rate, but risks 10% per trade
- Wins average +10%, losses average -10%
- After 10 trades (7 wins, 3 losses): $10,000 × 1.10^7 × 0.90^3 = $14,205
- But if they hit a bad streak first (3 losses): $10,000 × 0.90^3 = $7,290
- Vulnerable to ruin during natural variance
Trader B: 50% win rate, risks 2% per trade with 3:1 reward-to-risk
- Wins average +6%, losses average -2%
- After 10 trades (5 wins, 5 losses): $10,000 × 1.06^5 × 0.98^5 = $12,061
- After a bad streak (5 losses): $10,000 × 0.98^5 = $9,039 (only 9.6% drawdown)
- Survives variance with consistent edge
The lesson: Trader B has worse predictions but better mathematics. Over hundreds of trades, Trader B builds wealth; Trader A blows up during inevitable bad runs.
This is why every professional trader prioritizes risk management. Strategy gets you edge; risk management ensures you survive long enough to compound it.
The 1-2% Rule: The Foundation
The most universal rule in trading: never risk more than 1-2% of your capital on a single trade.
How It Works
For a $10,000 account:
- 1% rule: Maximum $100 loss per trade
- 2% rule: Maximum $200 loss per trade
Your "risk" is the distance from entry to stop loss × position size. If you buy SOL at $200 with a stop at $190:
- Risk per share = $10
- With $100 max risk (1% rule): Position size = 10 shares = $2,000
- With $200 max risk (2% rule): Position size = 20 shares = $4,000
Why 1-2%?
Mathematical survival: A trader losing 10 consecutive trades at 2% risk loses ~18% (compounding effect). The same trader at 10% risk loses 65% — likely catastrophic. Streak losses happen — even with great strategies.
Emotional management: Losing 1-2% is psychologically tolerable. Losing 10% creates desperation, revenge trading, and emotional decisions that compound losses.
Drawdown recovery: From 18% drawdown, need ~22% gain to recover. From 65% drawdown, need 186% gain to recover. The math is unforgiving.
Beginner vs Advanced Sizing
Beginners: Stick to 1% maximum per trade. The first year is about survival and learning, not maximizing returns.
Intermediate (after demonstrated profitability): 1-2% per trade.
Advanced (proven consistent edge over 2+ years): Up to 2-3% per trade on highest-conviction setups.
Never: 5%+ risk per trade. No matter how confident. No matter how "obvious." Markets humble overconfident traders constantly.
The Position Sizing Formula
Memorize this formula. Use it on every trade:
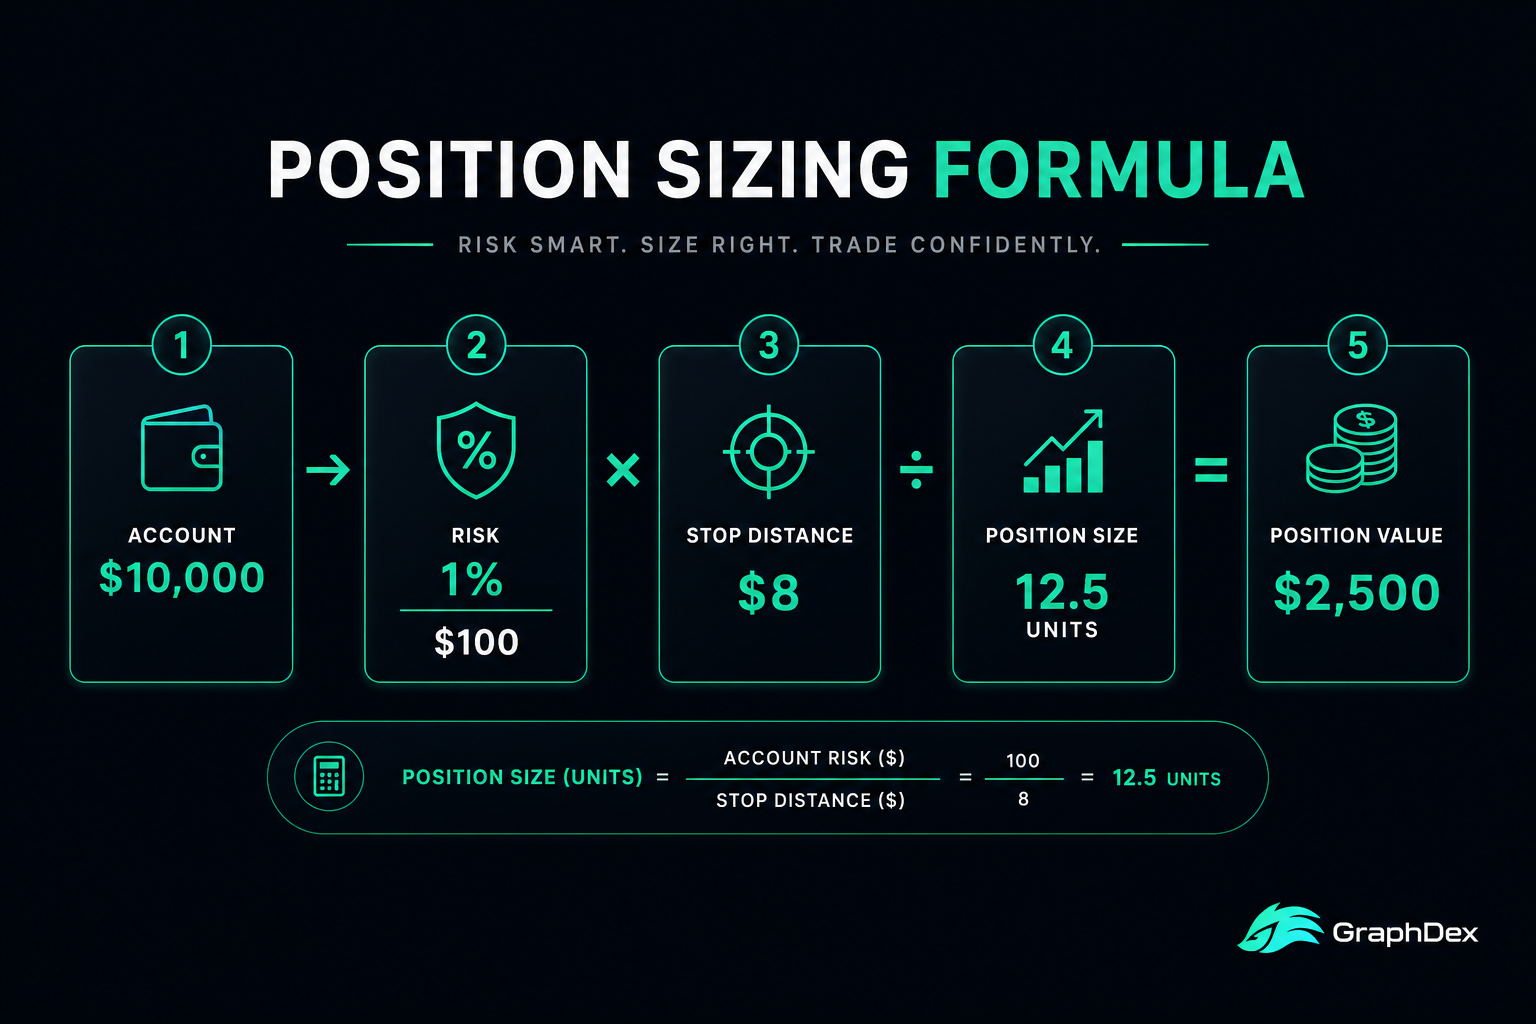
Position Size = Account Risk ÷ Stop Distance
Step-by-Step Calculation
Step 1: Determine account risk per trade
- $10,000 account × 1% = $100 risk per trade
Step 2: Determine your stop distance (in percent or dollars)
- Entry: SOL at $200
- Stop loss: $192
- Stop distance: $8 or 4%
Step 3: Calculate position size
- Position size = $100 ÷ $8 = 12.5 SOL
- Dollar value = 12.5 × $200 = $2,500
Step 4: Verify against account
- Total exposure: $2,500 (25% of $10,000 account)
- Maximum loss: $100 (1% of account) — confirmed
Why This Formula Works
Most beginners size positions based on "feel" or available capital — both wrong approaches.
Wrong approach: "I have $5,000 free, let me put $5,000 in this trade." This makes risk completely dependent on stop placement — a tight stop = small risk, but a wide stop = catastrophic risk.
Right approach: Define risk first (1-2% of account), then size position to fit that risk regardless of stop distance.
The formula automatically adjusts position size to maintain consistent risk:
- Tight stop = larger position (still 1% risk)
- Wide stop = smaller position (still 1% risk)
- Same dollar risk regardless of trade specifics
This is the foundation of professional trading.
Risk-Reward Ratios
The other half of position sizing math: how much can you win vs. how much can you lose?
What Is Risk-Reward Ratio?
Risk-Reward Ratio = Potential Reward ÷ Potential Risk
If you risk $100 to potentially gain $300, your risk-reward is 3:1.
Why It Matters: The Math of Win Rates
A trader's profitability depends on both win rate AND risk-reward:
| Win Rate | 1:1 R/R | 2:1 R/R | 3:1 R/R |
|---|---|---|---|
| 30% | -40% expected | +20% expected | +80% expected |
| 50% | 0% expected | +50% expected | +100% expected |
| 70% | +40% expected | +110% expected | +180% expected |
The insight: A 30% win rate with 3:1 R/R outperforms a 70% win rate with 1:1 R/R. Most successful traders have win rates of 40-60% but consistent 2:1 or 3:1 R/R.
The Minimum Standard: 2:1
Never take a trade with worse than 2:1 risk-reward. This single rule eliminates most bad trades.
Practical application:
- Identify entry, stop, target before trading
- Calculate potential reward (distance to target)
- Calculate potential risk (distance to stop)
- If reward ÷ risk < 2, skip the trade
How to Set Targets
Method 1: Use technical analysis. Next support/resistance level, measured move from pattern, key Fibonacci level.
Method 2: Use multiple of risk. Risk $100 → target $200 (2:1) or $300 (3:1).
Method 3: Scaling exits. Take partial profits at 1:1, more at 2:1, let runners go to 3:1+. Captures profits while letting winners run.
Daily and Maximum Drawdown Limits
Risk management isn't only per-trade — it includes time-based limits.
Daily Loss Limits
Set a maximum daily loss (typically 3-5% of account). When hit, stop trading for the day. No exceptions.
Why daily limits matter:
Tilt prevention: After losses, emotional state degrades. Decision quality drops dramatically. Continuing trading while tilted compounds losses.
Capital preservation: A bad day shouldn't become a catastrophic day. One -5% day is survivable; one -25% day requires 33% gain to recover.
Mental health: Trading is mentally draining. Daily limits enforce breaks.
Practical implementation:
- $10,000 account, 4% daily limit = stop at -$400
- After hitting limit, close trading platform
- No "one more trade to win back losses"
- Resume next day with clean emotional state
Maximum Account Drawdown
Set a maximum account drawdown (typically 20-25%). If hit, halt trading entirely. Reassess everything.
The procedure when hit:
Step 1: Stop trading immediately. Do not "trade back to even."
Step 2: Review the past 50-100 trades. Identify failures. Look for patterns.
Step 3: Determine what changed. Was strategy invalidated? Was discipline broken? Did market conditions shift?
Step 4: Either fix the issue with a new approach OR accept that current approach doesn't work and find another.
Step 5: Resume trading only with reduced size (50% of previous) until consistency returns.
This isn't optional. Traders who blow up almost always ignored drawdown limits — they kept doubling down hoping to recover.
The Math of Drawdown Recovery
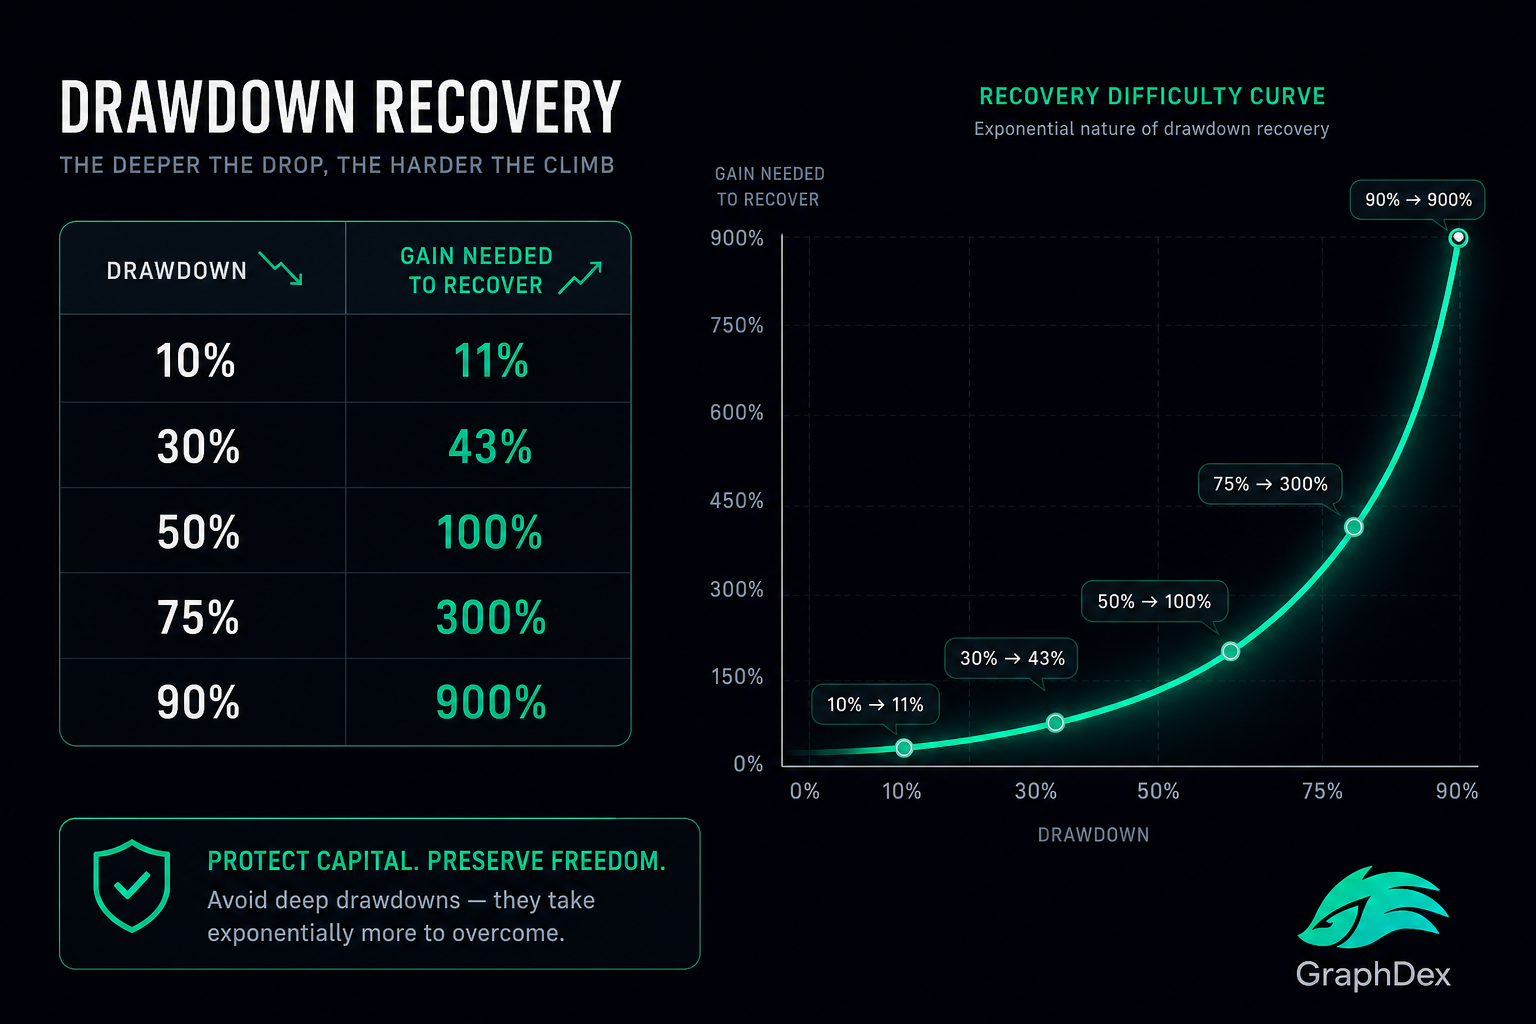
Recovery becomes harder as drawdowns deepen:
| Drawdown | Gain Needed to Recover |
|---|---|
| 10% | 11% |
| 20% | 25% |
| 30% | 43% |
| 50% | 100% |
| 75% | 300% |
| 90% | 900% |
Beyond 30-40% drawdown, recovery typically requires complete strategic reset. Avoid deep drawdowns through strict daily limits — much easier than recovery.
Position Correlation Risk
A risk most traders ignore: multiple positions in correlated assets concentrate risk.
What Is Correlated Risk?
If you have 5 long positions and all 5 are crypto memecoins, you don't have 5 trades — you have one bet that crypto memecoins go up. Correlation means these positions move together.
Examples of correlated positions:
- Multiple Solana memecoins (all behave similarly)
- Multiple L1 chain tokens (BTC, ETH, SOL, AVAX often correlate)
- Multiple DeFi tokens (UNI, AAVE, COMP often move together)
- Multiple AI tokens (TAO, FET, RNDR cluster on narrative)
- Multiple Ethereum L2s (ARB, OP, MATIC follow Ethereum)
Why It Matters
If your "1% per trade" risk is spread across 5 correlated positions, your actual risk is 5% on a single market move — not 1%. When that market moves against you, all 5 positions lose simultaneously.
Diversification Rules
Rule 1: Maximum 3 positions in same sector (memecoins, L1s, DeFi, etc.).
Rule 2: Maximum 5-7 total active positions across all sectors.
Rule 3: Aim for low correlation between positions (e.g., BTC long + USDT yield + a Solana memecoin short have lower correlation than 5 memecoin longs).
Rule 4: Consider macro correlation — most crypto correlates with broader market sentiment. Ten "diversified" crypto positions can still behave like one big bet during major events.
Practical Implementation
For a $10,000 account at 1% risk per trade:
- 1 position = $100 risk = manageable
- 3 correlated positions = $300 effective risk = 3% on the underlying narrative
- 7 correlated positions = $700 effective risk = 7% on the underlying narrative
The fix: either reduce position count, reduce per-trade risk, or genuinely diversify across uncorrelated assets.
Leverage and Risk Multiplication
A critical topic for derivatives traders: leverage multiplies both gains AND losses.
How Leverage Works
5× leverage: $1,000 of margin controls $5,000 of exposure 10× leverage: $1,000 of margin controls $10,000 of exposure 50× leverage: $1,000 of margin controls $50,000 of exposure
When you use leverage, you're not "trading more money" — you're amplifying your existing position's impact on your account.
Liquidation Risk
At 10× leverage, a 10% adverse price move wipes out 100% of your margin. The position is "liquidated" — closed automatically with full loss.
At 50× leverage, a 2% adverse move liquidates.
For volatile crypto where 5-10% intraday moves are normal, high leverage is functionally guaranteed liquidation given enough time.
The Smart Leverage Approach
Beginners: Avoid leverage entirely. Master spot trading first.
Intermediate (1-2 years experience): 2-3× maximum. Provides flexibility without catastrophic liquidation risk.
Advanced (proven consistent profitability): Up to 5× on highest-conviction setups. Always with strict stop losses well before liquidation prices.
Never: 10×+ leverage as a beginner. Almost guaranteed eventual liquidation.
Adjusting Position Size for Leverage
Critical: leverage doesn't change your risk-per-trade allowance. If you're risking 1% of account, that's the maximum loss whether using 1× or 10× leverage.
Example with 10× leverage:
- Account: $10,000
- Risk per trade: $100 (1%)
- Stop distance: 2% from entry
- Position size: $5,000 ($100 ÷ 2%)
- Margin required at 10×: $500
The leverage lets you control $5,000 of exposure with only $500 of margin — but the risk per trade remains $100. The leverage is capital efficiency, not increased risk.
This is the professional approach. Most retail traders use leverage to take bigger positions (10× larger risk), which is the unprofessional approach that leads to ruin.
Risk Management for Memecoin Trading
Memecoins require modified risk management due to extreme volatility and rug pull risk.
Higher Risk Requires Smaller Positions
Standard crypto: 1-2% risk per trade with 5-10% stops typical.
Memecoins: 0.5-1% risk per trade due to:
- Higher volatility (30-50% moves possible)
- Rug pull risk (total loss possible)
- Liquidity risk (slippage on exits)
- Manipulation (single whales can move prices)
Use On-Chain Analysis
For memecoins, traditional TA must be supplemented with on-chain data:
Holder distribution analysis (Bubble Maps): Avoid tokens with extreme concentration (top 10 holders >50% supply).
Liquidity verification: Confirm liquidity is locked or sufficient for your exit size.
Contract analysis: Verify no malicious functions (mint capability, blacklist, fee changes).
Volume verification: Distinguish genuine volume from wash trading.
The 100% Loss Rule
For memecoins specifically: assume 100% loss is possible on every trade. This shapes position sizing.
If you can't afford to lose the entire position to a rug pull, the position is too large. Memecoins go to zero regularly — usually >90% of new launches fail completely.
Sizing Across Many Memecoins
If you trade memecoins frequently, consider total memecoin exposure separately:
Total memecoin allocation: No more than 5-15% of total trading capital across ALL memecoin positions combined.
This caps total catastrophic-loss exposure even if you have 10+ memecoin positions running.
Common Risk Management Mistakes
For balance, the patterns that destroy traders:
1. Risking more than 2% per trade. The single most common cause of blow-ups.
2. Moving stop losses against you. "Just a little more room" — the death sentence of trading.
3. Adding to losing positions. "Averaging down" without thesis change. Compounds losses instead of cutting them.
4. No stop losses at all. "I'll watch it carefully." Watching doesn't stop slippage during gaps or fast moves.
5. Inconsistent position sizing. Going bigger when feeling lucky, smaller when scared. Risk should be consistent.
6. Ignoring correlation. 5 memecoin positions = 1 bet. Effective risk is much higher than nominal risk.
7. Trading after losses without break. Tilted state guarantees more losses. Take breaks.
8. Leverage without adjustment. Using 10× while keeping same position size as 1× = 10× risk.
9. No daily loss limit. Bad days become catastrophic days.
10. Holding through invalidation. When your thesis is broken, exit. Don't hope.
11. Sizing based on confidence. "I'm sure about this one" is exactly when bigger losses happen. Risk should be consistent regardless of conviction.
12. Forgetting drawdown math. 50% drawdown requires 100% gain to recover. Avoidance is much easier than recovery.
Trade with proper risk management on GraphDex Solana terminal
Building a Risk Management System
Putting it all together — your personal risk management system should answer these questions before every trade:
Pre-Trade Checklist
1. What's my account balance today? Determines absolute risk amount.
2. What's 1-2% of that balance? This is my maximum risk for this trade.
3. Where's my stop loss? Based on technical invalidation, not arbitrary distance.
4. What's my position size? Risk amount ÷ stop distance.
5. What's my target? Must be at least 2× my risk distance for valid R/R.
6. How does this position correlate with existing positions? Avoid concentration.
7. Have I hit my daily loss limit? If yes, no new trades today.
8. Is this consistent with my overall risk strategy? No "exceptional" trades that break rules.
Trade Management Checklist
1. Stop loss in place? Set immediately upon entry. Non-negotiable.
2. Target order in place? Or scaling exit plan defined.
3. Position size correct? Verify against pre-trade calculations.
4. Plan documented? Trade journal entry with reasoning.
Post-Trade Checklist
1. Update account balance. For next trade's sizing.
2. Update trade journal. Outcome, lessons, mistakes.
3. Check daily P&L. Approaching daily limit?
4. Review patterns. Any concerning trends in recent trades?
This system feels mechanical, but mechanical is the goal. Emotional trading destroys; systematic trading survives.
Apply risk management on GraphDex Solana terminal
How GraphDex Supports Risk Management
For active Solana traders implementing risk management:
- Multi-timeframe charts for accurate stop placement based on structure
- Volume integration for sizing decisions based on liquidity
- Bubble Maps for memecoin holder concentration assessment (critical risk filter)
- Pulse feed identifying high-volatility tokens requiring smaller position sizes
- AI signals providing additional confirmation reducing low-probability trades
- MEV protection preventing slippage that destroys risk calculations
- Sub-cent fees so risk calculations aren't distorted by transaction costs
- Non-custodial Privy wallet — your funds, your stops, your risk control
- Fee-based 17% APY staking on idle capital between trades — risk-free yield on the cash portion of your portfolio
For risk-disciplined traders, the integrated approach means risk calculations work cleanly without fee distortion or platform-imposed slippage from MEV attacks.
Frequently Asked Questions
What is risk management in crypto trading? Risk management is the practice of limiting how much capital you lose on any single trade or losing streak. Core principles: never risk more than 1-2% per trade, maintain 2:1+ risk-reward ratios, set daily loss limits (3-5% account), and have maximum account drawdown limits (20-25%). Risk management is more important than strategy for long-term survival.
How much should I risk per crypto trade? 1-2% of total capital maximum. Beginners should stick to 1%. For a $10,000 account, this means $100 maximum loss per trade. Position size adjusts automatically based on stop distance to maintain this fixed risk. Anyone risking more than 2-3% per trade is essentially gambling regardless of skill level.
What's the position sizing formula? Position Size = Risk Amount ÷ Stop Distance. Example: $10,000 account, 1% risk = $100 max loss. Trade entry $200, stop $192 = $8 stop distance. Position size = $100 ÷ $8 = 12.5 units. Total position value = 12.5 × $200 = $2,500. The formula ensures consistent risk regardless of trade specifics.
What is risk-reward ratio? The ratio of potential profit to potential loss on a trade. Minimum acceptable: 2:1 (potential reward at least 2× potential risk). Better trades target 3:1 or higher. The math: a 50% win rate with 3:1 R/R produces consistent profits; an 80% win rate with 1:2 R/R loses money. R/R matters more than win rate.
What's a daily loss limit and why do I need one? A maximum daily loss (typically 3-5% of account) after which you stop trading for the day. Critical because: (1) emotional state degrades after losses, hurting decision quality; (2) prevents bad days from becoming catastrophic days; (3) enforces necessary mental breaks; (4) preserves capital for trading when you have clear edge.
How do I size positions with leverage? Same way as without leverage — based on account risk, not on margin available. If risking 1% of account with 10× leverage: account $10,000, risk $100, stop distance 2% means position size $5,000 (controlling $5,000 with $500 margin at 10×). Leverage is for capital efficiency, not bigger risk. The position size and risk remain identical regardless of leverage used.
Can I survive crypto trading without risk management? Almost certainly not. Studies consistently show 70-90% of retail crypto traders lose money — almost universally due to poor risk management, not bad strategies. The 10-30% who succeed long-term virtually all use strict risk management. There are essentially no consistent winners who ignore risk principles.
About This Guide
This guide is published by the GraphDex Research team — analysts and traders building the infrastructure for digital asset trading on Solana. Our content is based on direct trading experience and observation of successful trading practices.
Sources & data: Risk management principles reflect universal trading best practices. All trading carries substantial risk including total loss of capital. Risk management reduces but doesn't eliminate this risk. This guide is educational and not financial advice.
GraphDex is the infrastructure for digital asset trading — trade, predict, and earn in one place. Learn more at graphdex.io.
Last reviewed: May 2026 · GraphDex Research
The infrastructure for digital asset trading. Trade, predict, stake, repeat. graphdex.io


